


Many traders start using technical analysis to try and make additional profits, but it is also possible to incorporate risk management indicators into a technical analysis strategy. Learn about the most important risk management indicators and how to utilise them.
Not all trades are winners, and it is important to understand and accept this fact when starting to invest. With that in mind, it is equally important to learn how to manage risk effectively to limit the impact that loss-making trades have on your overall profits.
Technical analysis risk management indicators can help you to manage exposure to potential losses, and are ideal tools to use when navigating the financial markets. They can provide signals to cut positions early and help you to evaluate your strategy planning.

What are risk management indicators?
Technical analysis risk management indicators analyze historical market data to identify points on a price chart at which traders can “draw a line in the sand.”
If a position is loss-making, this might be the point at which price rebounds and losses are recouped. Alternatively, if the price continues to move through the price level and losses increase, it marks the point at which the trading strategy can be considered to have failed. At that point, closing out the trade reduces the risk of further losses.
Before implementing your risk management strategy, it is worth taking a step back and considering what it aims to address. There are several common mistakes that traders make, including:
- Expecting a rebound
- Lacking a trading plan
- Engaging in personal bias or emotional trading
- Taking a position that is too large
- Insufficiently monitoring positions
How to use risk management indicators
There are hundreds of different technical indicators available, and each one offers a different way of using hard data to interpret market mood. Individual indicators can be used to identify a specific price level at which to cut positions, but it is a good idea to consider the whole range of technical analysis tools on offer to build a more rounded view. That is also why it is useful to use chart analysis and price patterns to cross-reference your analysis.
Stop-loss
A stop-loss instruction is one of the most widely used technical analysis risk management tools. These are automated instructions, built into your trading platform, that will reduce or close out a position at a predetermined price level.
There are many indicators that can be used to assess the potential level of support or resistance. However, if price breaks through that level, there is likely to have been a significant change in market conditions, and closing out a position will reduce the risk of further losses.
Stop-losses can be set just outside of price levels that technical analysis considers to be “normal.” For example, this could be below a supporting trend line, as in the GBPUSD chart below. Setting a stop-loss below a rising trendline, as demonstrated by the dotted line, will close out a position when the uptrend stalls and a new downtrend forms.
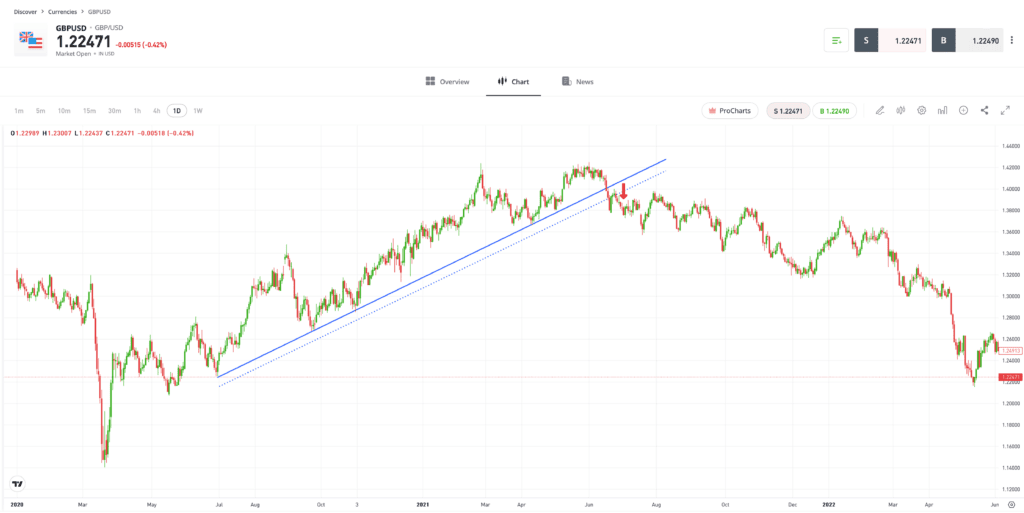
Past performance is not an indication of future results
Source: eToro
Tip: New strategies should be trialled first using a demo account.
A stop-loss can also be set outside of a Bollinger Band, as is the case in the oil price chart below. In this example, note that a reversal of an upward trend is signalled by price trading outside the lower Bollinger Band, which is then followed by a downward trend.
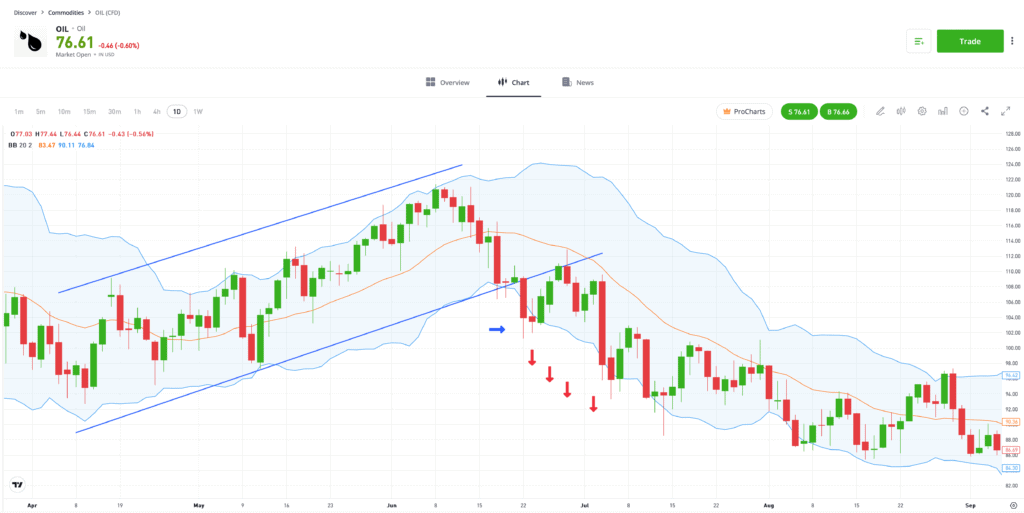
Past performance is not an indication of future results
Source: eToro
Position sizing
Taking smaller positions can help to remove the emotion from trading. This can help you to stick with your strategy, rather than panicking and closing out of a position that might ultimately turn profitable.
Position sizing should be adjusted to suit the risk-return of a trading idea or to account for changing levels of market volatility.
It is also important to clarify what “small” means to you as a trader, as this will ultimately help to instil discipline into your trading. Some experienced traders prefer to limit the risk on a single trade to 1% of their available capital.
With that approach in mind, if you were to have $1,000 in your account, then the difference between your trade entry price and stop-loss would equate to a cash loss of $10.
Tip: To increase the risk-reward ratio, some traders will risk 2-5% of their total capital on a trade.
Risk-reward ratio
It is possible to adapt your position size management by factoring in the likelihood of a trade being successful and adjusting your ratio accordingly. The more confident you are in a trade, the greater the percentage of your capital can be risked, and vice versa for riskier setups.
After you have considered the size of any loss you are willing to accept, it is important to also establish the scale of any profits on the trade. Analyzing risk-reward ratios will help you to determine whether or not it is a good idea to open a trade.
For example, if your strategy has a risk-reward ratio of 1:3, then it only needs to be successful more than 33% of the time for you to make a net profit on a collection of trades.
| Breakeven Win Percentage | Risk-Reward Ratio |
|---|---|
| 50% | 1:1 |
| 33% | 1:2 |
| 25% | 1:3 |
| 16.66% | 1:5 |
| 9.09% | 1:10 |
Tip: Risk-reward should be adjusted to suit market conditions, with risk being scaled back when price volatility is higher.
Final thoughts
It takes time to develop an effective technical analysis risk management strategy. Not only do you need to allow time for trades to complete their natural life cycle, but it is also important to study the results and evaluate what went right and wrong. Doing so is part of the process of learning how to improve your trading and potentially reach your goals.
Visit the eToro Academy to learn how to manage risk using technical analysis.
Quiz
FAQs
- Do all traders use stop-losses?
-
Not all traders use stop-losses, and even fans of the approach will not use them all of the time. There is a risk that a momentary period of increased price volatility will trigger a stop-loss before price reverts back to previous levels. Some traders remove stop-losses before important news announcements, as those are times when price can “whipsaw.” However, this is a very risky strategy that can lead to significant losses. Instead, some traders prefer to exit positions ahead of these announcements to avoid the volatile price action.
- How important is win-loss ratio?
-
The win-loss ratio is an important tool that can be used to assess the success rate of your trading activity. Remember, a win-loss ratio should not be the sole determinant of whether you make a profit from trading or not. It is possible to have a 99:1 win-loss ratio and still make a loss overall if the one losing trade is significant in size.
- What is a trailing stop-loss?
-
A trailing stop-loss is an instruction to close out a position, much like a regular stop-loss. However, a trailing stop-loss is able to track moves in profit-making trades. For example, if you buy Tesla stock and the price then rises, the stop-loss will also rise to a higher level. The intention being that if price reverses, you will lock in some element of profit.
This communication is for information and education purposes only and should not be taken as investment advice, a personal recommendation, or an offer of, or solicitation to buy or sell, any financial instruments.
This material has been prepared without taking into account any particular recipient’s investment objectives or financial situation and has not been prepared in accordance with the legal and regulatory requirements to promote independent research. Any references to past or future performance of a financial instrument, index or a packaged investment product are not, and should not be taken as, a reliable indicator of future results.
eToro makes no representation and assumes no liability as to the accuracy or completeness of the content of this publication.