


Price charts play a crucial role in trading and investing because studying historical price moves can provide clues as to where prices might head next. Learn about the different types of technical analysis charts, and how support, resistance, trends and trend lines work.
The current price of an asset, alongside its historical price history, can be considered the starting point of most trading strategies. Proponents of fundamental analysis will consider an asset’s current valuation and then incorporate “real world” factors, while those interested in technical analysis strategies will typically give much more weight to “price action” and often base trading decisions on charts alone.

Why do people use charts in technical analysis?
Technical analysis charts allow you to analyze how a price has moved in the past, and from there, determine which direction it might move in the future. It is possible to identify trends, and moments when trends stop and reverse, and use technical indicators to establish if a market might currently be overshooting either upwards or downwards.
Charts can be set to different time frames, so it is possible to consider price moves that occur over minutes, hours, days, weeks or months. Charting can accommodate traders using short- and long-term strategies, but to understand the overriding direction of the market, it is usually best to consider price charts that show a longer time frame.
Tip: “Charting” is a form of trading that bases trading decisions entirely on price action.
Types of technical analysis charts
All price charts plot an asset’s price over time. The simplest representation of this is a line chart, but there are other factors and data points that can be incorporated into the visual display.
This is done to make the chart more informative and to allow traders to gain a better and instant understanding of market conditions.
Past performance is not an indication of future results
Source: eToro
Bar chart
The bar chart introduces the terms opening price, closing price, high price and low price. For any time interval, whether it is 10 seconds or one month, each bar will show each of those prices in graphic form.
Past performance is not an indication of future results
Source: eToro
Candlestick
A candlestick chart follows the same methodology as a bar chart, but the area between the opening and closing price is shown as the “body” of the candle. These bodies can be color-coded according to whether the price moved up or down during the interval, which allows traders to get an immediate understanding of market mood.
Past performance is not an indication of future results
Source: eToro
Point & figure
A point and figure chart displays price history as a series of columns made up of either X’s or O’s. A rising price is represented as a column of X’s and a falling price by a column of O’s. Again, the same underlying price data is being used, just illustrated in a different format.

Support and resistance indicators
The terms “support” and “resistance” refer to price levels on a chart at which the price struggles to break below or above. An upward trend that keeps failing to break above a specific price level is described as meeting resistance, an example of which can be seen in the Apple chart below.
| Apple price chart with resistance levels (2020 – 2023) |
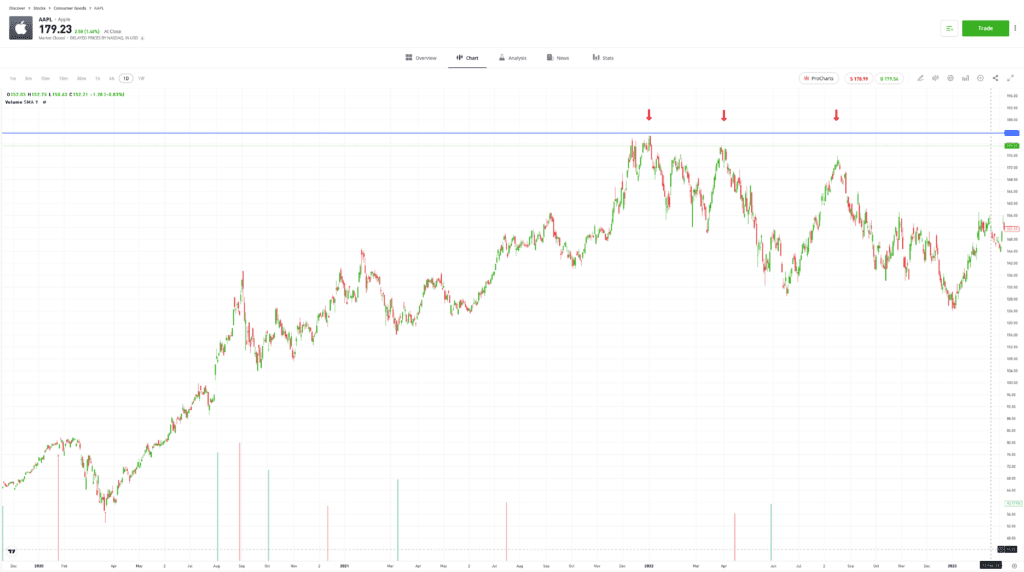
Past performance is not an indication of future results
Source: eToro
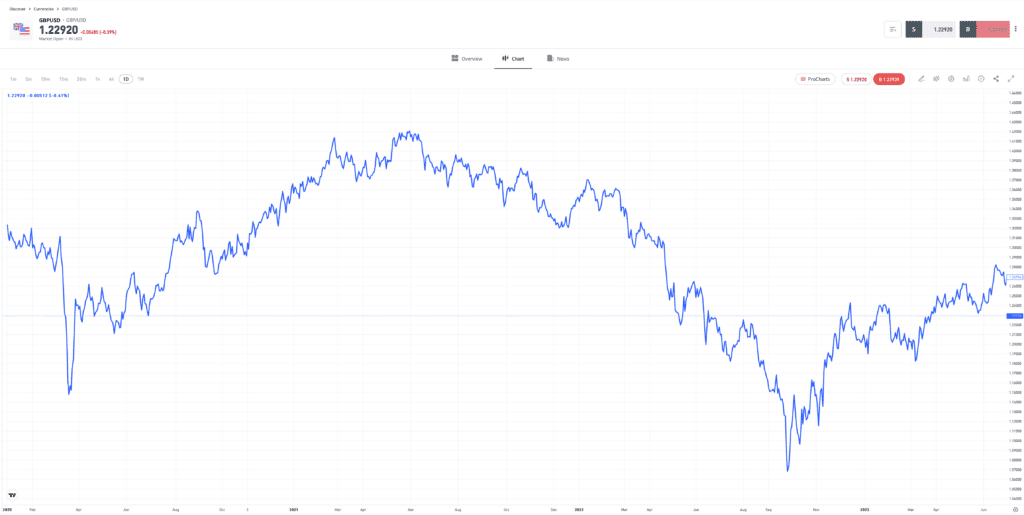
At the same time, some markets have levels at which price struggles to break below. These support levels can be based on technical analysis indicators, or even something as simple as a “round number.” In the example below, the UK100 Index failed to break below the psychologically important 6,800 support price level on four separate occasions.
| UK100 price chart with support levels (2020 – 2023) |
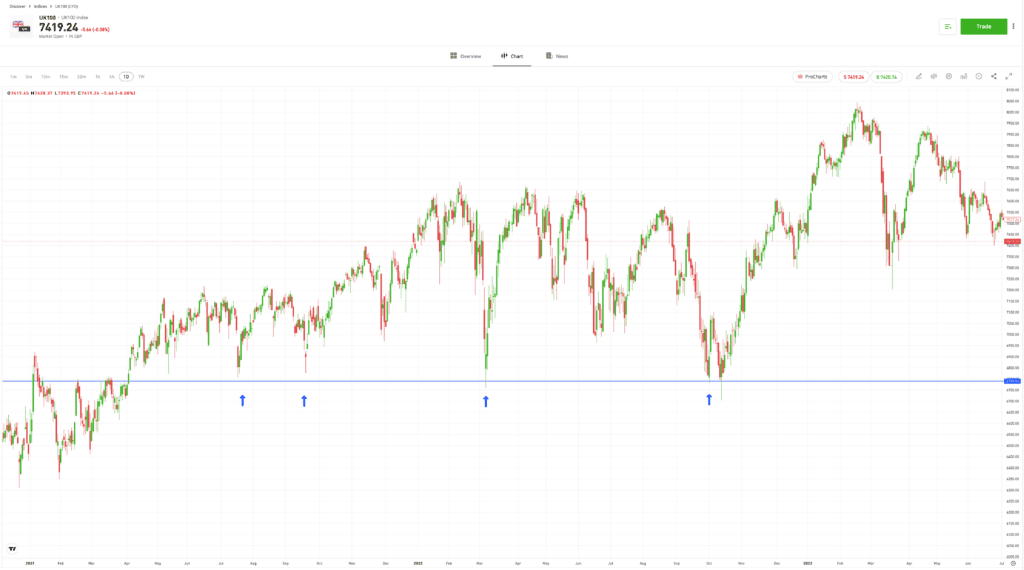
Past performance is not an indication of future results
Source: eToro
Tip: The principles of chart analysis are the same, although longer-term price charts give a better idea of underlying trends.
Trends and trendlines
Identifying and backing a trend are among the most important aspects of trading, and many investors will use price charts to help them achieve this. This simple technique involves identifying trend lines that track an underlying move in price.
These can be upwards or downwards, and the point at which the price touches an established trend line can serve as an optimal entry point, assuming the trend holds.
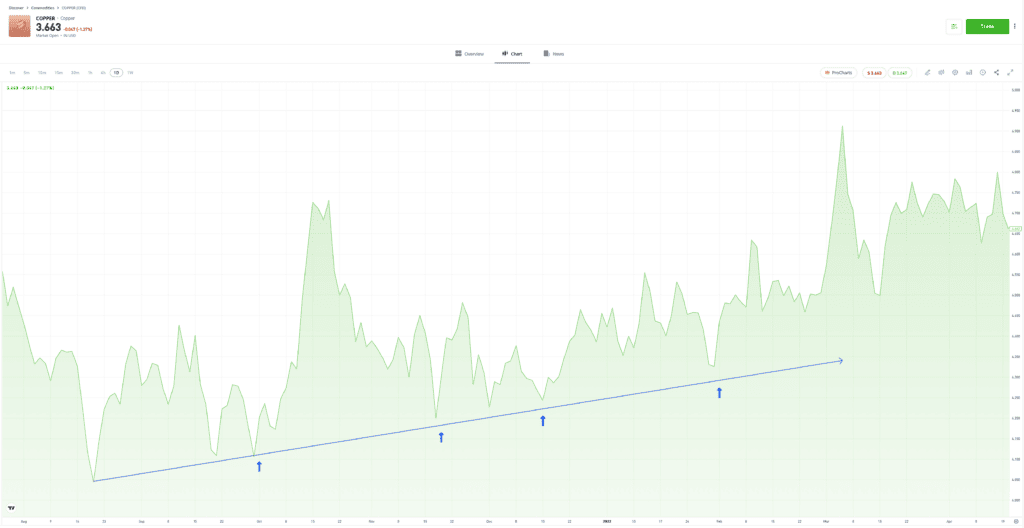
Past performance is not an indication of future results
Source: eToro
All trends come to an end, and this point is marked on the chart by a trend line break. This is usually a signal to exit out of positions, and a reminder that reversal in trading activity can create a trend heading in the opposite direction.
| Trendline break in copper with new downwards trend forming (2021 – 2023) |
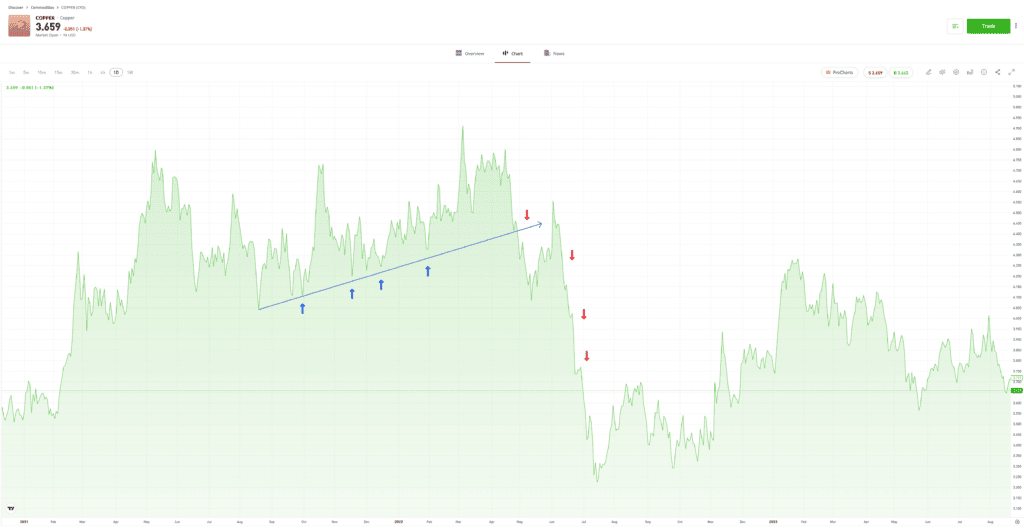
Past performance is not an indication of future results
Source: eToro
Tip: A trend is considered “confirmed” when there are at least three incidences of price touching the line and rebounding.

Final thoughts
Chart analysis cannot help you to establish if an asset is over or undervalued in terms of fundamental analysis. However, studying price moves and analyzing chart data can help you to form a considered view on which direction price is heading. The approach can be used independently or in conjunction with other investment approaches to help you understand the best times to buy and sell an asset.
Visit the eToro Academy to learn how to best utilize your price chart analysis.
Quiz
FAQs
- Who should use chart analysis?
-
A range of investors and traders study price action. Chart analysis supports a wide range of strategies and can be applied to any market. Day traders may consider short-term price charts, but even long-term investors using fundamental analysis can benefit from using charts to identify the best moments to buy.
- What is the best chart time interval to use?
-
The best time interval on a chart will depend on the specific approach of an investor or trader. If you are running short-term strategies, then you might use chart time intervals of hours, minutes, or even seconds. The longer your investment time horizon, the more likely you are to look for indicators on charts that are set at daily, weekly or monthly time intervals.
- What are Heiken-Ashi candles?
-
Heiken-Ashi candles resemble traditional candlestick patterns but have a smoother appearance and are designed to help traders spot trends. The candles are formatted by applying mathematical formulas to the basic criteria of any candlestick chart to generate different-looking candles. This criterion includes opening and closing prices, as well as interval high and low prices. Heiken-Ashi candles are one of many ways that price data can be represented on a chart.
This communication is for information and education purposes only and should not be taken as investment advice, a personal recommendation, or an offer of, or solicitation to buy or sell, any financial instruments.
This material has been prepared without taking into account any particular recipient’s investment objectives or financial situation and has not been prepared in accordance with the legal and regulatory requirements to promote independent research. Any references to past or future performance of a financial instrument, index or a packaged investment product are not, and should not be taken as, a reliable indicator of future results.
eToro makes no representation and assumes no liability as to the accuracy or completeness of the content of this publication.