It’s the last trading session of 2024 and The Daily Breakdown is taking a closer look at the markets as 2025 looms.
Tuesday’s TLDR
- It’s the last day of 2024
- But it’s been choppy lately
- Breaking down the S&P 500 chart
What’s happening?
You’ve made it to the last trading day of 2024! And what a ride it has been.
Last Friday, we took some time to recap the year’s biggest winners and losers.
Some of it has been fun and easy, with big rallies and only tiny pullbacks. But there have been tough stretches too, where markets can’t seemingly pick a direction or a mood.
That may seem silly to say considering the S&P 500 is up more than 20% year to date and has hit almost 60 new record highs throughout the year. But it goes to show that even in a strong environment, it’s not always easy to capitalize.
In fact, right now is a great example.
We’re in the midst of the Santa Claus Rally, one of the strongest stretches for US stocks in the entire year. Yet, the S&P 500 is down more than 1% so far with a few days left to go.
Regardless of how it shapes up, 2024 was a good year for markets. Let’s enjoy the New Year’s celebration and turn our attention to 2025.
Want to receive these insights straight to your inbox?
The setup — S&P 500
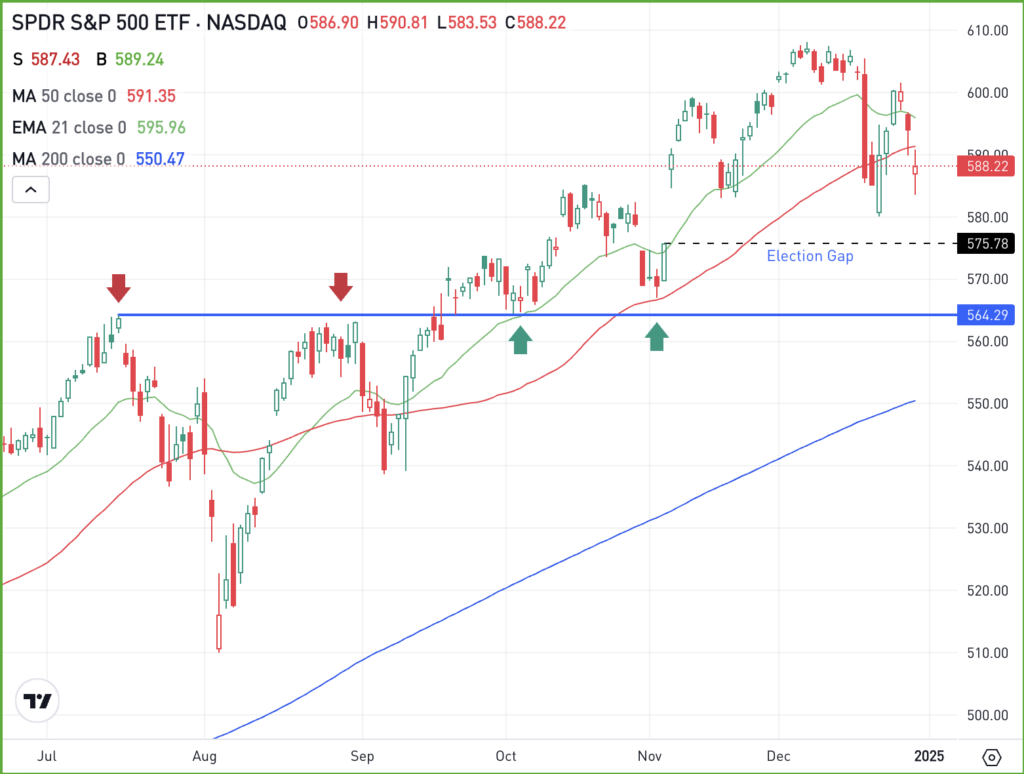
It’s been a while since we’ve looked at the S&P 500 and I want to do so with the SPY ETF. Notice how well the SPY has done at setting a strong uptrend in recent months:

Right now, the SPY is below its 21-day and 50-day moving averages. Put another way, it’s below its short- and intermediate-term trends. That’s not necessarily the end of the world, but it does suggest some caution here in the short term.
If the S&P 500 bounces from here, look to see how it handles these moving averages. If it can reclaim them, bulls could potentially regain momentum pretty quickly.
However, if more weakness ensues, there are a few areas to keep an eye on.
The first is around $576 — which is the gap-fill from the election. If the SPY continues lower, the $565 area and 200-day moving average will be on watch for a potential test. This was a key support/resistance level in Q3 and is an area bulls will want to defend, should the SPY fall that far.
What Wall Street is watching
GOOG – Alphabet’s stock surged 14% in December, leading the late-year gains for big tech despite antitrust challenges and AI competition. Key drivers included a quantum computing breakthrough and a rival’s exit from the robotaxi market. Analysts view the rally as a rediscovery of Google’s innovation potential.
MSFT – With one day left in 2024 and up about 14.5% so far this year, Microsoft had a pretty good year by most standards. However, the stock underperformed the S&P 500 and is the worst-performing Magnificent 7 holding this year. Will it be a leader in 2025?
XLC – The communications sector is set to end the year as the best-performing sector in the S&P 500, with a total year-to-date return currently clocking in at 35%. Top holdings in the ETF include Alphabet, Meta, Netflix, Disney, and T-Mobile.
Disclaimer:
Please note that due to market volatility, some of the prices may have already been reached and scenarios played out.


