

You may have felt a slight sense of unease if you checked your portfolio in recent weeks. I’m with you because even unrealised losses hurt. Whether you’ve been investing for 12 months or 12 years, seeing your portfolio in the red feels the same. Investing involves ups and downs, and while we can’t control the market, we can help you navigate through it. If history tells us anything, it’s that Trump loves shaking things up, and his latest tariffs are no exception. In short, tariff threats have turned into a tariff war and have now become a major source of market risk, injecting volatility into the world economy and keeping investors on edge. So, i’ll help you break it down, cut through the panic, and figure out what this all really means for your portfolio.
- New trade tariffs are hitting major US trading partners, raising concerns over economic growth, corporate earnings, and inflation risks.
- During a market sell-off, it’s crucial to stay calm, focus on your long-term financial goals, and avoid making impulsive decisions driven by fear. Market corrections have occurred throughout centuries of investing.
- It’s important to zoom out and look at the bigger picture. Previous trade wars caused sharp pullbacks but markets recovered. The S&P 500 is still up more than 16% in the last 12 months and has rallied more than 23% in 2023.
View eToro Academy
Trump and his tariffs
He’s only been in the White House for a couple of months, but President Trump is already causing a stir in global markets. His biggest move so far has been tariffs and on the 4th March, Trump made good on his promises, slapping 25% tariffs on imports from Canada and Mexico while doubling tariffs on Chinese goods from 10% to 20%.
These measures target the United States three largest trading partners, which together accounted for over 40% of U.S. imports in 2024. Canada and China retaliated with tariffs on US goods, escalating tensions and fueling fears of a broader trade war. For Trump, tariffs are a cornerstone of his economic strategy. He argues they’ll protect American manufacturing, create jobs, raise tax revenue, and rebalance trade deficits.
What on earth are tariffs, Josh?
I’m glad you asked. Essentially, tariffs are taxes paid by companies importing goods, in this case, into the United States. They’re calculated as a percentage of the product’s value and are designed to protect domestic industries by making foreign goods more expensive.
For example, the 20% tariffs on China mean a $10 Chinese-made item costs $2 more. The focus then turns to the importers. Do they take the hit to their profit margins or pass it on to consumers through higher prices? Either way, the ripple effects are higher costs for businesses, potential price hikes for shoppers, and a scramble to adapt supply chains.
So why are we seeing the stock market fall?
Trump’s tariffs could spark a full-blown trade war, creating uncertainty about their true economic impact. Markets often ‘front run’ potential outcomes, but investors remain wary of how these trade tensions could affect corporate earnings, economic growth, and overall market volatility.
Industries like car manufacturing, where parts crisscross the US, Mexican, and Canadian borders multiple times before a vehicle is finished, are especially vulnerable. Uncertainty is the key driver. Investors don’t know how companies will adapt, whether they’ll eat the costs, raise prices, or shift production. We also don’t know how retaliatory tariffs from Canada, China, and potentially others will hit US exporters.
Goldman Sachs estimates that every 5% increase in U.S. tariff rates could shave 1-2% off S&P 500 earnings per share. International sales make up 30% of S&P 500 company revenues and that matters, because in Q4 companies with higher international revenue saw stronger earnings growth than those with higher US revenue. According to FactSet, for companies that generate more than 50% of sales inside the US, the blended earnings growth rate is 14.4%. For companies that generate more than 50% of sales outside the US, the blended earnings growth rate is 20.8%.
Tech stocks that were already priced to perfection, thrown in with some AI concerns, have taken the brunt of the sell-off. Nvidia, a darling of the AI boom, has fallen over 20% from its highs as investors fret over supply chain disruptions and shrinking profit margins. More broadly, the Nasdaq has fallen 4% this year.
Another concern is that these tariffs will reignite inflation. Capital Economics predicts US inflation could climb from 2.9% to as high as 4% if tensions continue to escalate. That has the Federal Reserve on watch and means the view of no rate cuts this year is a real possibility.
Volatility and pullbacks are simply the price of entry into investing
Long-term retail investors need to keep a level head during turbulent times. The key is not to panic, which can be easy after checking your portfolio.
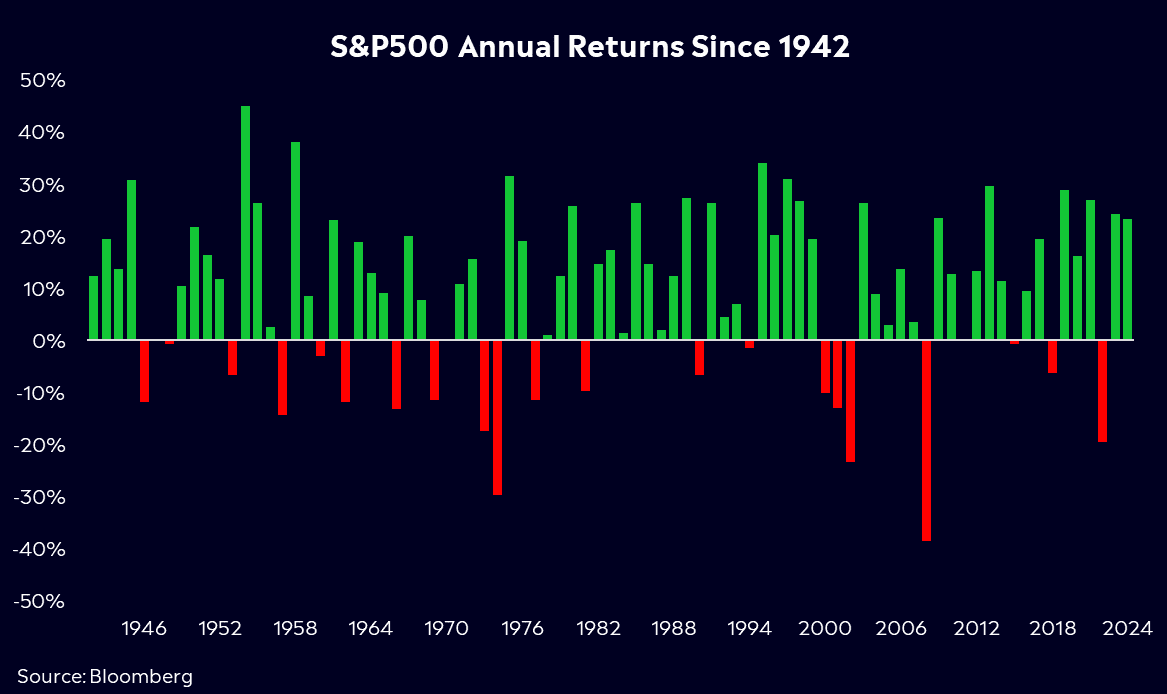
It’s important to remember that pullbacks are normal, and volatility is standard. Since 1974, the S&P 500 has averaged three pullbacks of 5% or more per year, while the average intra-year pullback is roughly 14%. We’ve seen five corrections (10% declines from peak to trough) in the last 9 years, and since 1974, the S&P 500 has returned over 24% on average following a correction.
Within the last year, including this current pullback, we’ve seen three pullbacks of more than 5%. Right now, the S&P 500 is down just 5% from its highs, so we’re well within the range of normal—this isn’t new for markets. The sell-off can, of course, deepen, but from July to August last year, the S&P 500 fell 8.5% before rallying as much as 17% from its lows.
For some more context, this isn’t the first time we’ve been here. During his previous tenure, Trump also provoked a trade war. In 2018, Trump introduced tariffs on China, and the ‘trade war’ lingered throughout the year. The S&P 500 fell 10% at the start of the year, but the market eventually clawed back. However, as tensions escalated, the S&P 500 had sunk 19.8% below its late-September peak by Christmas Eve 2018. By the final months of 2019, the worst of the trade war market volatility began to subside, with the S&P 500 finishing the year up 29% before rallying 16% the following year and 26.8% the year after.
In hindsight, the trade war’s major market impact came in waves. Each escalation triggered a sharp sell-off and surge in volatility, and each truce or trade deal sparked relief rallies. Throughout Trump’s first term, trade policy became a key driver of market volatility, causing several significant pullbacks. These were all short-lived, and markets ultimately bounced back. Although past performance is not a guarantee of future results, it’s a great reminder not to be short-sighted when investing.
On the other hand, the VIX, Wall Street’s “fear gauge” is still nowhere near the highs we’ve seen previously. In July last year, it hit a high of 65.73. Going back to 1990, that was the second-highest one-day rally in the VIX, trailing only the gain it saw on February 5, 2018—funnily enough, when Trump’s trade war previously started. So, although volatility hasn’t reached those levels yet, it has the potential to, and below are some tips on how to navigate that volatility.
Stay Focused
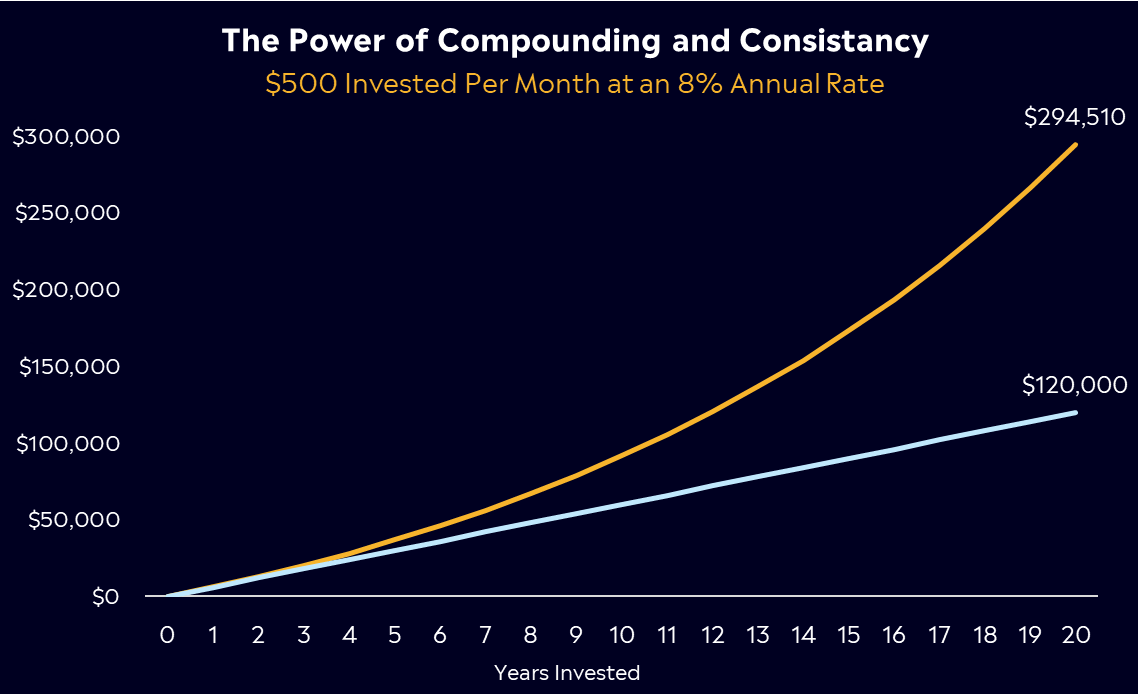
If you have a long-term investing plan, stick with it. A plan helps investors stick to the good ideas they came up with during calmer times. Those who consistently add to their long-term stock exposure tend to do well over time.
Selling investments in a panic can lock in losses. Historically, markets rebound, and those who stay invested often benefit from the recovery. Missing the best market days can significantly impact long-term returns. A JPMorgan study found that missing the ten best market days between 2004 and 2024 would halve your investment returns. Seven of those best days occurred within 15 days of the ten worst days.
We’re emphasising that timing the market is much harder than it seems, and getting it wrong can have significant consequences. A simple strategy like dollar-cost averaging can be highly effective. It rewards consistency over timing, allowing you to protect against the unpredictable nature of markets by spreading out your investments over time, typically in even increments.
- Rebalance as Needed: If volatility skews your asset allocation, consider rebalancing to maintain your long-term strategy.
- Use Dollar-Cost Averaging: Investing a fixed amount at regular intervals can help smooth out volatility.
- Focus on Fundamentals: Short-term noise shouldn’t dictate long-term decisions. The key is to invest in quality companies with strong fundamentals.
The importance of diversification
The current volatility highlights the importance of diversification in an investment portfolio. By spreading investments across a variety of assets, diversification reduces the impact of any single asset’s poor performance. In times of market turbulence, not all sectors or individual stocks react the same way; some may even see gains, which can help offset losses in other areas. This strategy smooths out the volatility in a portfolio, providing a steadier return over time and leading to better risk-adjusted returns.
Let’s take an S&P500 ETF as an example, this can be SPY, VOO, or IVV. This type of ETF invests in the 500 largest publicly traded companies in the US, offering broad market exposure. The S&P500 includes a wide range of industries such as technology, healthcare, finance, and consumer goods, which means that the ETF is inherently diversified across multiple sectors. Within the S&P500, different sectors perform differently based on various economic conditions. For instance, during a pullback in the technology sector, other sectors like utilities or consumer staples may perform better, thereby cushioning the overall impact on the ETF.
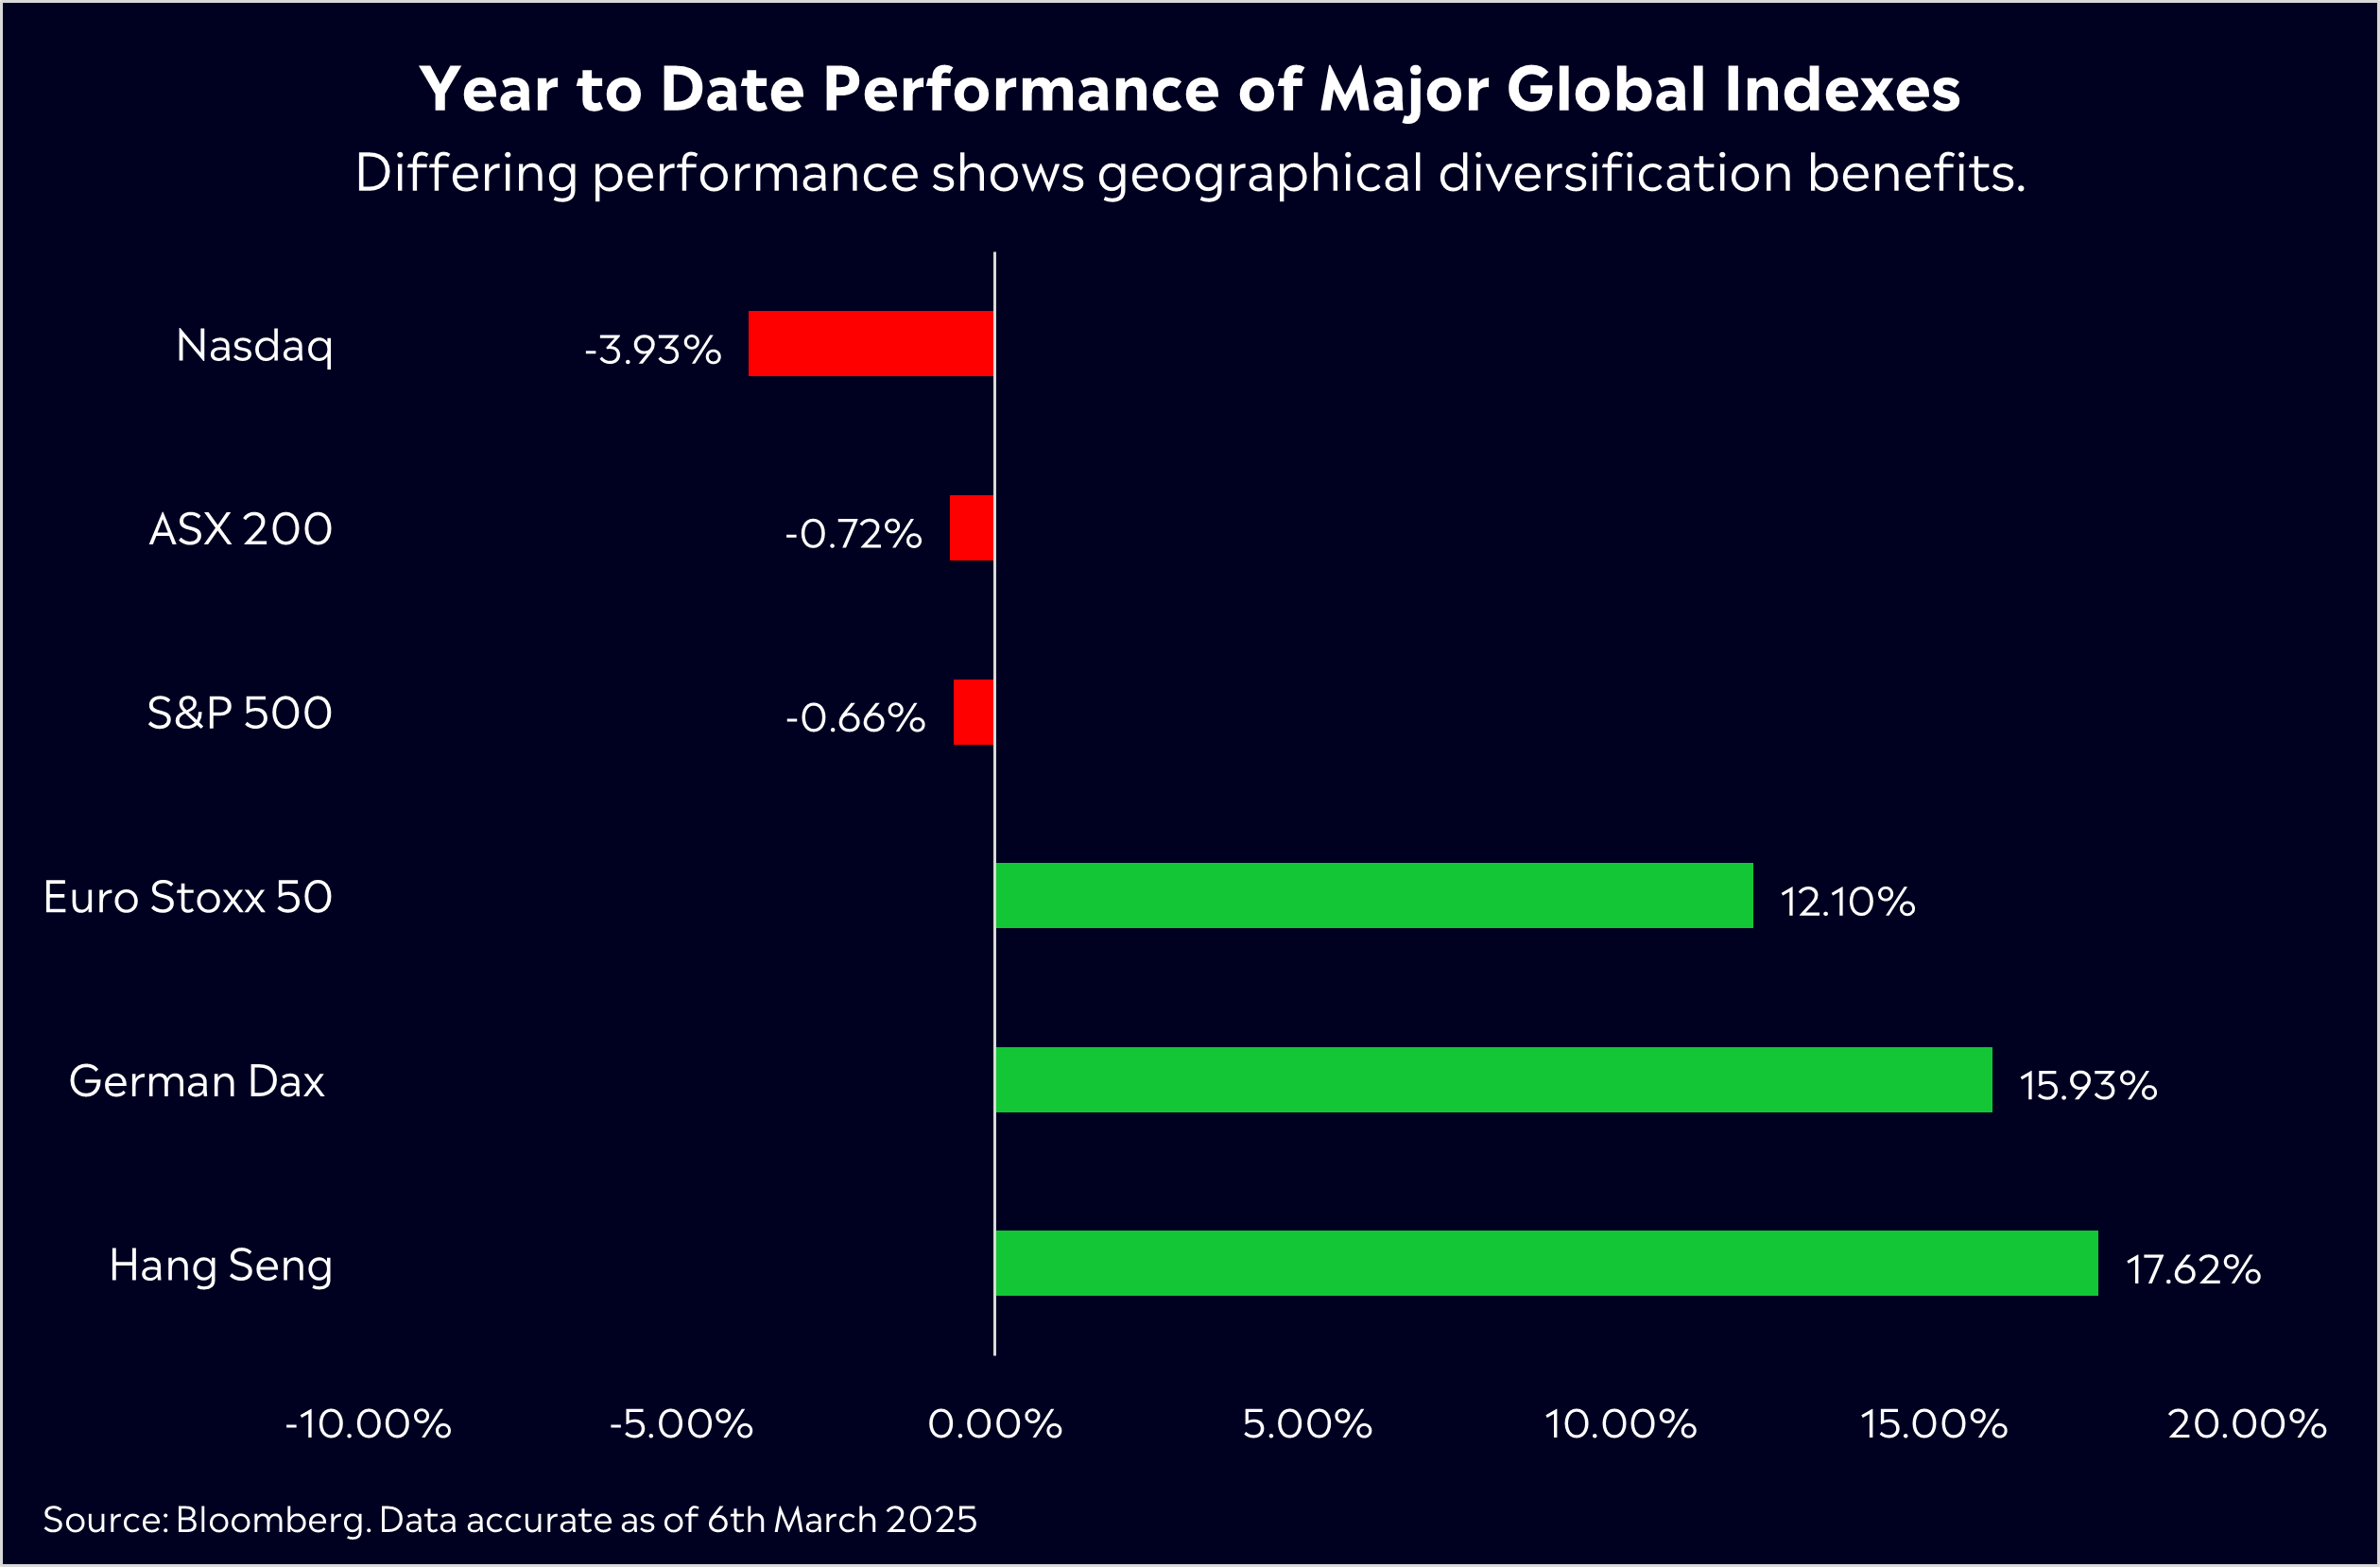
Another great example is geographical diversification. European stock markets have been on a strong run this year, even as global markets have pulled back. Year to date, the Euro Stoxx 50 has gained 12%, significantly outperforming the S&P 500, which has lost -0.66%. European earnings have played a key role in sustaining market momentum. The Q4 earnings season exceeded expectations, reviving EPS growth after a period of stagnation. With valuations still attractive (the forward price-to-earnings ratio for the Euro Stoxx 50 stands at 15.4x, significantly lower than the S&P 500’s 21.5x) and a shifting macroeconomic landscape, European stocks provide a strong case for diversification. Examples of European ETFs include: FEZ, VGK and EZU.
So, what’s next for you as an investor?
As I’ve said above, volatility might increase further, and the sell-off may deepen, but it’s still not a reason to run for the hills. If you’re a long-term investor, you may find opportunities to own quality companies at far more attractive prices, but it’s about being astute. Think of market sell-offs as a Black Friday sale event. They only appear every so often. It’s frustrating when you already own the discounted item (stocks), but it’s an exciting opportunity when looking for new stocks because they’re on sale. From a mental perspective, the stock market is the only place in the world where people run from lower prices.
But, there’s also nothing wrong with just riding out the volatility and keeping that portfolio closed for a while. Either way, here’s what I’d be watching:
Keep a close eye on trade negotiations and tariff announcements. Further escalation of trade tensions – such as new tariffs or breakdowns in talks – could spur more market volatility and downside for trade-sensitive stocks. Sectors like autos, aerospace, technology hardware, apparel, and agriculture are especially sensitive: tariffs can either raise their costs or make their products less competitive abroad. By contrast, more insulated sectors (utilities, finance, healthcare, real estate) might see less direct impact. This could see a rotation from mega-cap tech stocks into these particular sectors.
Conversely, any easing of tensions, rollbacks, or trade deals may lift the cloud of uncertainty and spark relief rallies. We saw this during the last trade war of 2018/19, so it could be on the horizon.
At the end of February, the S&P 500 was trading at 26x forward earnings. As I said earlier, it was priced to perfection. That meant little room for disappointment, but we got exactly that. The Magnificent Seven, on the other hand, have seen valuations drop significantly, trading as high as 36x forward earnings at the start of the year to 27x now.
Bottom line? While this pullback may be tough for investors, particularly those with heavy exposure to the Magnificent Seven, it’s a healthy correction for the market overall and investors shouldn’t panic when the market dips.
View eToro Academy
eToro Service ARSN 637 489 466 promoted by eToro AUS Capital Limited ACN 612 791 803 AFSL 491139. Capital at risk. See PDS and TMD. This communication is general information and education purposes only and should not be taken as financial product advice, a personal recommendation, or an offer of, or solicitation to buy or sell, any financial product. It has been prepared without taking your objectives, financial situation or needs into account. Any references to past performance and future indications are not, and should not be taken as, a reliable indicator of future results. eToro makes no representation and assumes no liability as to the accuracy or completeness of the content of this publication.