


Understanding forex volatility and the key technical indicators to look out for is a crucial aspect of FX trading. This guide will explain what forex volatility is, how it is measured and why more experienced forex traders often incorporate it into their strategy planning.
What is forex volatility?
Forex price volatility measures the extent that the price of a currency pair moves over a given period. It is calculated using historical price data and provides traders with a simple representation of market sentiment.
Forex volatility changes over time. For example, an unexpected geopolitical event can cause the volatility of a single currency pair to change, if the event is localised. Alternatively, a market-wide shock can cause all currency markets to become more volatile at the same time.

Why is forex volatility important for FX traders?
Volatility levels, and the extent to which price moves over time, might make one type of trading strategy preferable to another — meaning, it could be a better fit for current market conditions. For example, a swing-trading strategy would arguably be a better fit for a higher volatility market than a lower volatility market.
Referring to forex volatility metrics can also better prepare a trader for the market they’re entering and help them to adopt an appropriate trading mindset before they start.
Tip: A successful strategy can become an unprofitable one if volatility levels change, and vice versa.

Reducing risk with forex hedging
Forex hedging involves placing additional trades or buying other instruments to protect the returns of a larger position. For example, a trader that has taken, and is showing profit on, a long position in GBPUSD, may book a smaller additional “sell” trade to try and protect their investments on the underlying position.
The GBPUSD chart shown below from 2022 to 2023 is an example of forex hedging by booking an opposite trade.
| GBPUSD 2022–2023 – Forex hedging by booking opposite trade |
For illustration purposes only. Past performance is not an indication of future results
Source: eToro
Tip: Increased volatility and the risk that emotions influence your trading decisions is a challenge faced by all traders.
Options can be used for both speculation and hedging. Options would generate a profit if the price of the currency pair reversed, but could be left to expire if the underlying trade continued to move in the intended direction. Of course, there are risks attached to options trading, and profit is not guaranteed, but this is an avenue that some forex traders explore.
| GBPUSD 2022–2023 – Forex hedging using options |
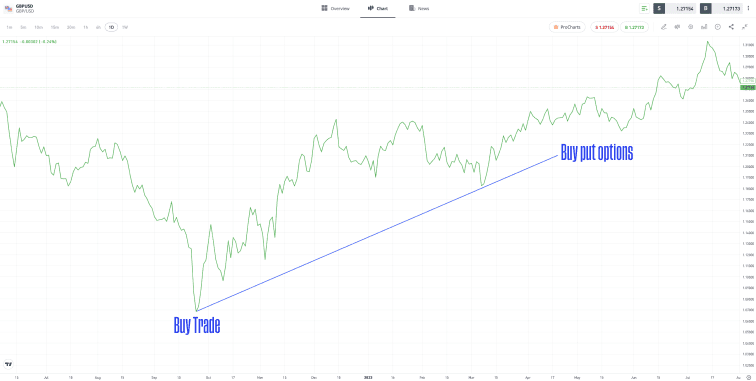
For illustration purposes only. Past performance is not an indication of future results
Source: eToro
Markets can remain irrational longer than you can remain solvent.
John Maynard Keynes
Forex volatility indicators
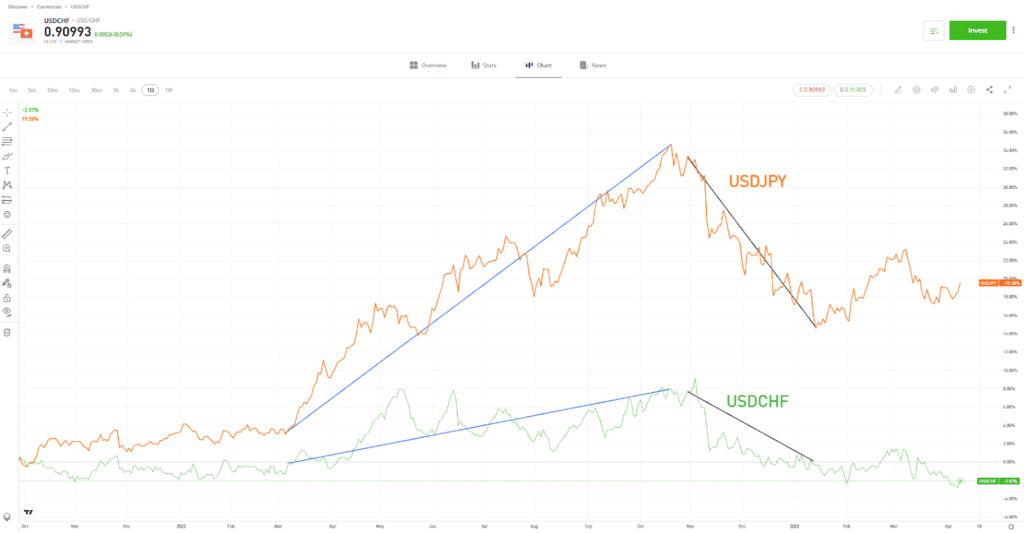
A quick scan of a price chart should instantly provide an idea of how volatile a market is. Higher peaks and lower troughs point to the market overshooting to the upside and downside, respectively. For example, in the price charts below, the price of USDJPY deviates from the long-term average to a greater extent than USDCHF does.
| CHFUSD vs USDJPY – Daily price chart – 2021–2023 |
Past performance is not an indication of future results
Source: eToro
Using mathematical formulae is a slightly more methodical approach to measuring forex volatility. There are various models available, each converted into an easy-to-use indicator that can be added to your price chart dashboard by clicking a button.
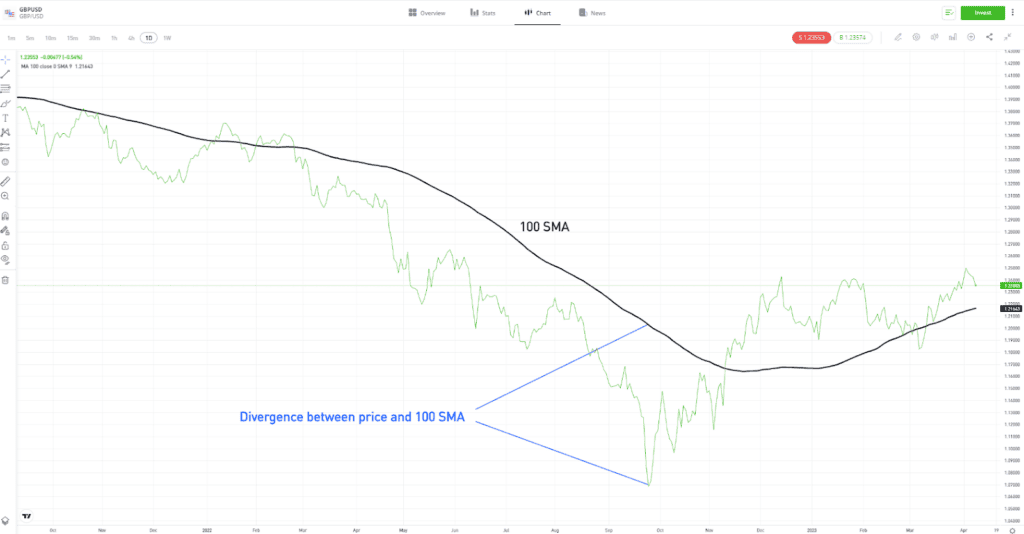
- Moving Averages — Simple Moving Averages (SMAs) and Exponential Moving Averages (EMAs) are the basic building blocks of most forex volatility indicators. They calculate and demonstrate the average price over a specified time period. Popular date settings include 20, 50, 100 and 200 days. In the short term, the more the price diverges away from the long-term average, the greater the current market volatility.
| GBPUSD – Daily price chart – 2021–2023 – 100 SMA |
For illustration purposes only. Past performance is not an indication of future results
Source: eToro
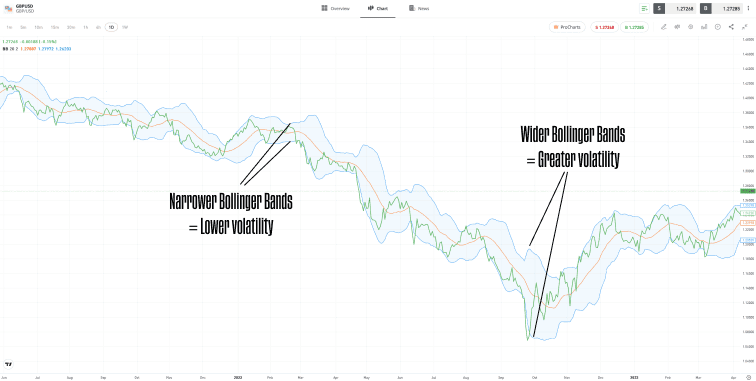
- Bollinger Bands — These measure and illustrate the degree to which price deviates from a long-term average. They use standard deviation metrics to pinpoint moments at which any additional price movements away from the long-term average would be unlikely, statistically speaking.
| GBPUSD – Daily price chart – 2021–2023 – Bollinger Bands |
Past performance is not an indication of future results
Source: eToro
Tip: Volatility indicators offer clues as to whether price trends might retreat or breakout when they reach support and resistance levels.
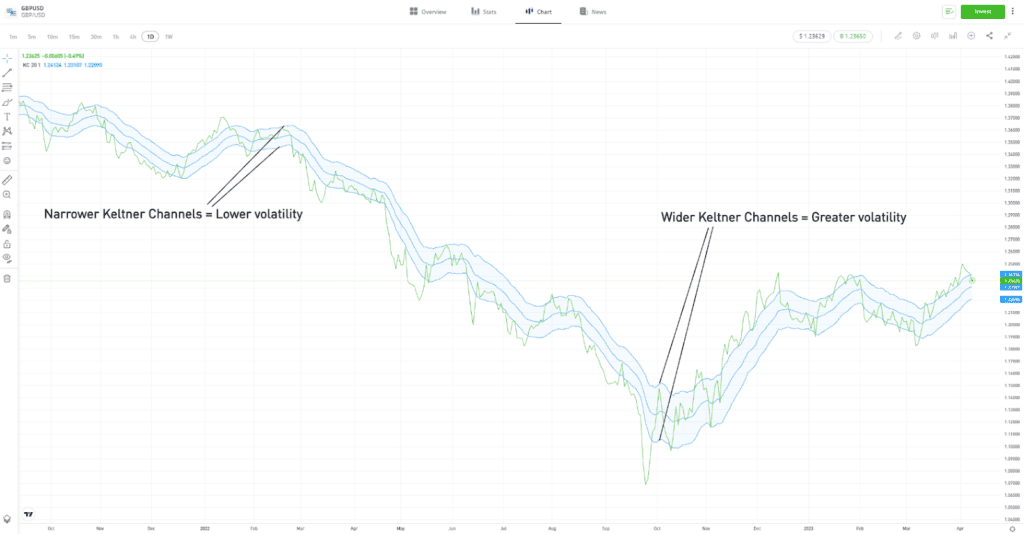
- Keltner Channel — The Keltner Channel indicator adds another layer to the process of measuring price deviation from a long-term average. In this case, the Keltner Channel measures deviation from the EMA. It factors in extreme readings of high and low prices and when volatility increases, the channel gets wider, and vice versa.
| GBPUSD – Daily price chart – 2021–2023 – Keltner Channel |
For illustration purposes only. Past performance is not an indication of future results
Source: eToro
Tip: Consider using multiple indicators in combination, so that your strategy generates fewer, but stronger, signals regarding when to trade.

How to calculate forex volatility
Turning raw data into something more useful involves calculating the “variance” using the following steps:
- Calculate the mean average of the data points.
- Subtract the mean average from each of the data points.
- Square those numbers (so that negative and positive data points do not cancel each other out).
- Sum the total of the squared numbers and divide by the number of data points (days) to find the mean average of the variations — the variance.
Some analysts will then find the square root of the variance, which is known as the “standard deviation” of the data set. This is a mathematical formula that measures how spread out numbers are. Some volatility indicators are based on variance, but standard deviation is the metric most traders refer to when considering volatility.
- Easy to learn
- Self-fulfilling
- Highly adaptable
- A numerical representation of market mood
- A lagging indicator
- Non-directional
- Can generate a false signal
- Reduced effectiveness in non-trending markets
Final thoughts
Individual traders will typically find that a certain amount of volatility suits their approach and risk tolerance. Therefore, it can make sense to identify and trade markets that meet your preferred level of volatility at any one time. This might involve trading a currency pair that you had not previously considered trading.
Visit the eToro Academy to learn more about forex trading.
Quiz
FAQs
- Can a forex market have too little volatility?
-
Forex traders need some degree of price volatility if they are going to spot trade entry points and still make a profit. However, even low volatility markets can be traded if the right type of strategy is used.
- Do volatility indicators help to identify price direction?
-
Strictly speaking, no, volatility indicators are not designed to offer any insight into whether any price move will be upwards or downwards. Volatility indicators explain the extremity of price moves and how the degree of change alters over time. Those looking to identify market direction may want to consider researching momentum indicators instead.
- What causes price volatility to change?
-
The underlying factors that determine price also determine the level of volatility in a market. Interest rates, inflation and unemployment levels can all play a part in making a currency more or less attractive to an investor. During times when these variables are influencing supply and demand to a greater extent, volatility levels can be expected to rise.
This information is for educational purposes only and should not be taken as investment advice, personal recommendation, or an offer of, or solicitation to, buy or sell any financial instruments.
This material has been prepared without regard to any particular investment objectives or financial situation and has not been prepared in accordance with the legal and regulatory requirements to promote independent research. Not all of the financial instruments and services referred to are offered by eToro and any references to past performance of a financial instrument, index, or a packaged investment product are not, and should not be taken as, a reliable indicator of future results.
eToro makes no representation and assumes no liability as to the accuracy or completeness of the content of this guide. Make sure you understand the risks involved in trading before committing any capital. Never risk more than you are prepared to lose.