


Technical analysis can be used to spot trading opportunities and manage positions, and these principles can be used across a range of different markets and asset types. Learn how to identify asset class characteristics with technical analysis, and how to use technical analysis to understand how markets operate.
The core principles of technical analysis can be applied to any market and can be used when trading stocks, indices, forex, crypto or commodities. Using technical indicators to establish conditions in different markets will allow you to find those that suit your approach, while also allowing you to monitor the changes in conditions over time.

How to identify asset class characteristics
Price charts detail price and time, but they also contain additional useful metrics. Utilising the available data can offer insight into any market’s current conditions, and perhaps provide an indication of how the situation might change over time, while also allowing you to compare the conditions in markets of different asset classes.
Price volatility is a crucial technical measure, and it is important to find a market that experiences price moves that suit your risk tolerance.
Changes to trade volumes should also be taken into consideration. Increased trading activity can bring about price moves, and therefore trading opportunities, and an influx of new buyers or sellers can demonstrate the formation of a trend.
Tip: Trading signals that appear during periods of higher trade volumes are typically considered to be stronger.
How does the time-of-day impact trading?
The opening and closing stages of a trading session are typically the busiest periods of the day. When an exchange opens, investors often rush to enter or exit positions, according to developments that occurred overnight.
On the other hand, volumes tend to pick up at the end of the trading session as investors take the opportunity to adjust positions before the close.
In the Tesla Inc chart below, it is possible to see how trade volumes increase at different points in the trading session, typically correlating with more significant price moves.
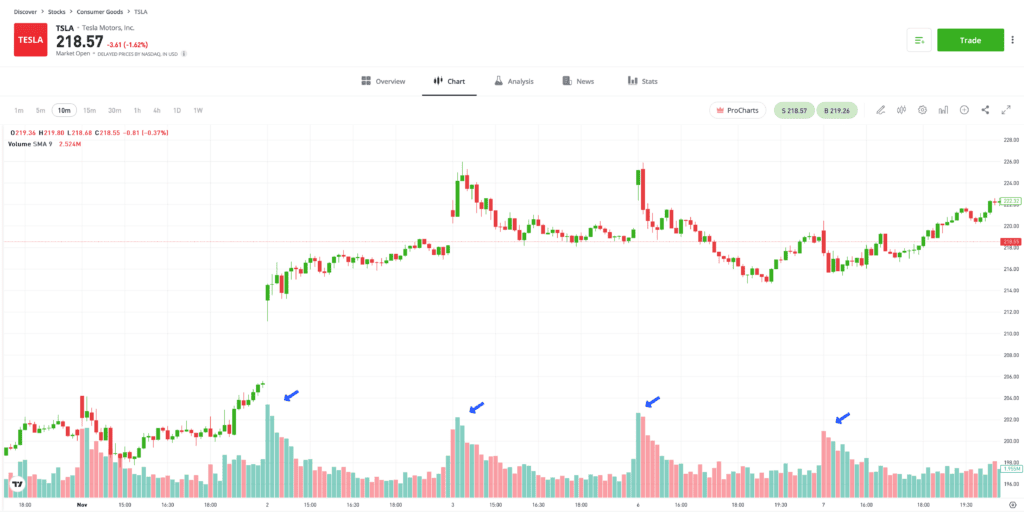
Past performance is not an indication of future results
Source: eToro
How does time-of-day impact different strategies?
Systematic trading strategies have historically been more active during the opening and closing of a market. They are drawn to the increased “flow”, and many strategies are designed to operate when trading volumes are higher.
Day traders typically only hold positions for a single day, so are more likely to open positions when exchanges first open and close them before the final bell.
Investors with a buy-and-hold approach might prefer to trade during quieter periods. As long as their position size isn’t large enough to move the market price, they can trade in and out of positions with less risk of the price whipsawing as they do so.
Tip: Major news announcements can be announced at any time of day and can trigger intraday spikes in volatility.

Using technical analysis to understand how different markets trade
A market that is experiencing greater price fluctuations must be approached very differently to one in which the prices are more stable. It is possible to access metrics that calculate and report volatility, but basic charting analysis allows you to immediately establish that cryptocurrencies, such as Dogecoin, are more likely to experience increased volatility compared to Unilever stocks, for example.
| 12-month price chart for Dogecoin (2022-2023) |
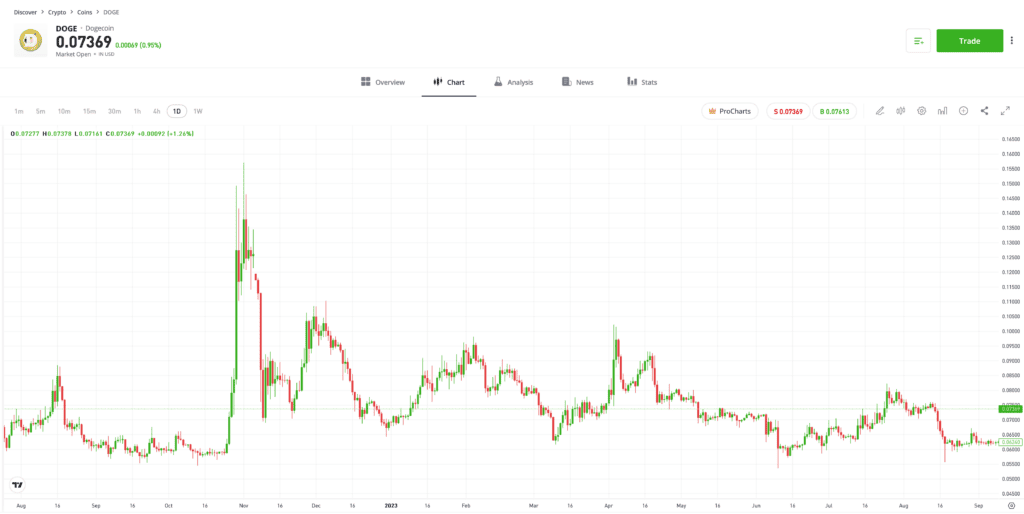
Past performance is not an indication of future results
Source: eToro
Tip: Technical indicators can outline whether a market is trending or ranging, which should influence your strategy selection.
| 12-month price chart for Unilever (2022-2023) |
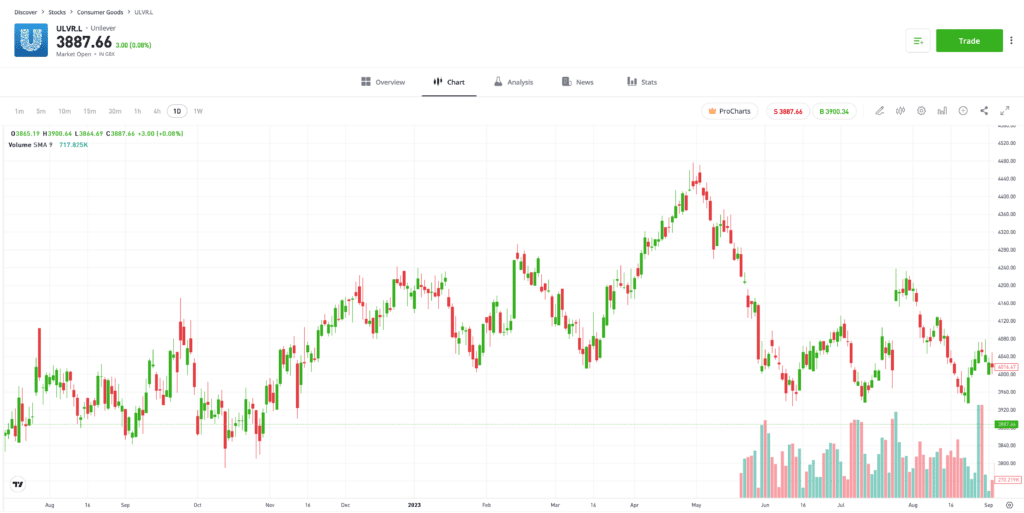
Past performance is not an indication of future results
Source: eToro
Comparing conditions across different markets is useful, but there can also be a benefit to considering how a single market changes over time.
For example, seasonality can impact stock markets, which typically record lower volatility during summer months when key decision makers at big investment companies might be on annual leave. Economic cycles should also be considered, as they can guide price for extended periods of time.
Tip: Some traders look for markets with higher price volatility because their strategies are prepared for greater degrees of risk-return.
Conditions in markets can also change over shorter time scales. The forex market can be traded on a 24/5 basis, but because of time-zone differences, there are peaks in activity and price volatility at certain times of the day. For example, the Eurodollar currency market has historically seen volumes pick up when European and US exchanges are both open at the same time.
In the EURUSD chart below, it is possible to see that the Bollinger Bands widen at 13:00 in London.
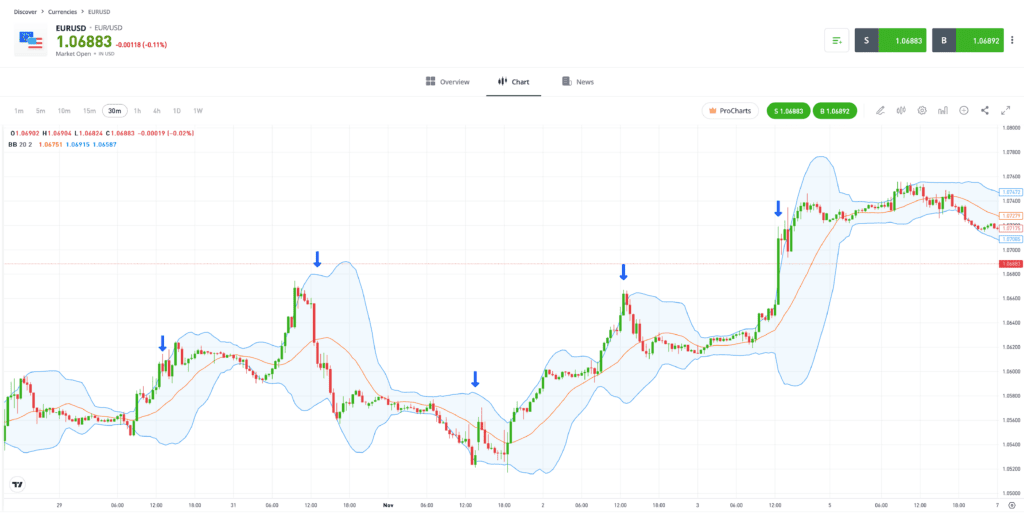
Past performance is not an indication of future results
Source: eToro
Tip: Bollinger Bands can measure forex price volatility, with a widening band occurring when price moves become more extreme.
Using technical analysis to understand what drives markets
Technical analysis relies entirely on historical market data, which means that it does not factor in the influence of real-time, real-world events. The situation can be resolved by using fundamental analysis, which incorporates information relating to financial reports, geopolitical events, corporate news and macroeconomic cycles, all of which helps to drive the markets.
Tip: Certain asset classes are closely correlated with others, for example, USD currency pairs and the US equity markets.
Final thoughts
Technical analysis can be used to trade any market. It can also help you to identify the markets that best suit your chosen strategy. Different markets will be experiencing uptrends, downtrends and range-bound trading at the same time, and so one of those trading environments could be an ideal fit for your risk-profile and investment aims.
Visit the eToro Academy to learn more about technical analysis and asset classes.
Quiz
FAQs
- How can I measure market sentiment?
-
Some instruments can give an insight into market sentiment. For example, the VIX Volatility Index, sometimes referred to as the “Fear and Greed” index, offers a measure of risk appetite among investors and can also be bought and sold to hedge portfolios.
- How can I find out about upcoming news?
-
An economic calendar contains information on upcoming announcements by various organisations such as central banks and corporations. Calendars can be filtered to personal preference so that they provide information relating to the markets you are trading, which makes it easier to keep up to date with events.
- What are the most important news announcements to look out for?
-
This will depend on the market you are trading, but some economic announcements, such as the US Non-Farm Payroll report, have wide-ranging effects. That report is released on the first Friday of every month and details the unemployment situation in the world’s largest and most important economy.
This communication is for information and education purposes only and should not be taken as investment advice, a personal recommendation, or an offer of, or solicitation to buy or sell, any financial instruments.
This material has been prepared without taking into account any particular recipient’s investment objectives or financial situation and has not been prepared in accordance with the legal and regulatory requirements to promote independent research. Any references to past or future performance of a financial instrument, index or a packaged investment product are not, and should not be taken as, a reliable indicator of future results.
eToro makes no representation and assumes no liability as to the accuracy or completeness of the content of this publication.
eToro is a multi-asset investment platform. The value of your investments may go up or down. Your capital is at risk.
CFDs are complex instruments and come with a high risk of losing money rapidly due to leverage. 74% of retail investor accounts lose money when trading CFDs with this provider. You should consider whether you understand how CFDs work and whether you can afford to take the high risk of losing your money.
Cryptoasset investing is highly volatile and unregulated in the UK and some EU countries. No consumer protection. Tax on profits may apply.