

The Daily Breakdown takes a closer look at the S&P 500 and the SPY ETF as the index undergoes a massive correction.
Wednesday’s TLDR
- A little pep talk
- Delta earnings, inflation in focus
- Charting the S&P 500
What’s happening?
Yesterday looked like it was going to be a strong session for US equities, but more trade-war headlines sapped momentum from stocks. As we approach mid-week, a few events stand out.
First, Delta Air Lines will report earnings this morning. Delta should have a good pulse on the state of the traveler and be able to provide an update on travel trends both in the US and internationally. Then tomorrow morning, we’ll get the latest inflation update via the CPI report.
Right now though, investors are just trying to go one day at a time amid a tense and volatile trading environment.
While the historical trends do favor long-term forward returns after large declines, the volatility certainty chips away at investors’ emotions in the short term. The best suggestions to remember at times like this include: Avoid over-leveraging your account, think long term, understand what you own, and know your timeframe.
You will get through this, just like we’ve gotten through past turmoils.
Want to receive these insights straight to your inbox?
The setup — S&P 500
I apologize that the weekly chart below is so zoomed out, but it was the only way to capture the long-term trend. Feel free to visit the charting feature and take a closer look if you’d prefer.
Notice how the S&P 500 ETF (SPY) has nearly retested its prior bull market high from January 2022.
Yes, it’s painful that we’ve essentially unwound more than three years of stock-market progress in just a couple of weeks. But bulls are focused on this area for more than just a retest of the prior high.
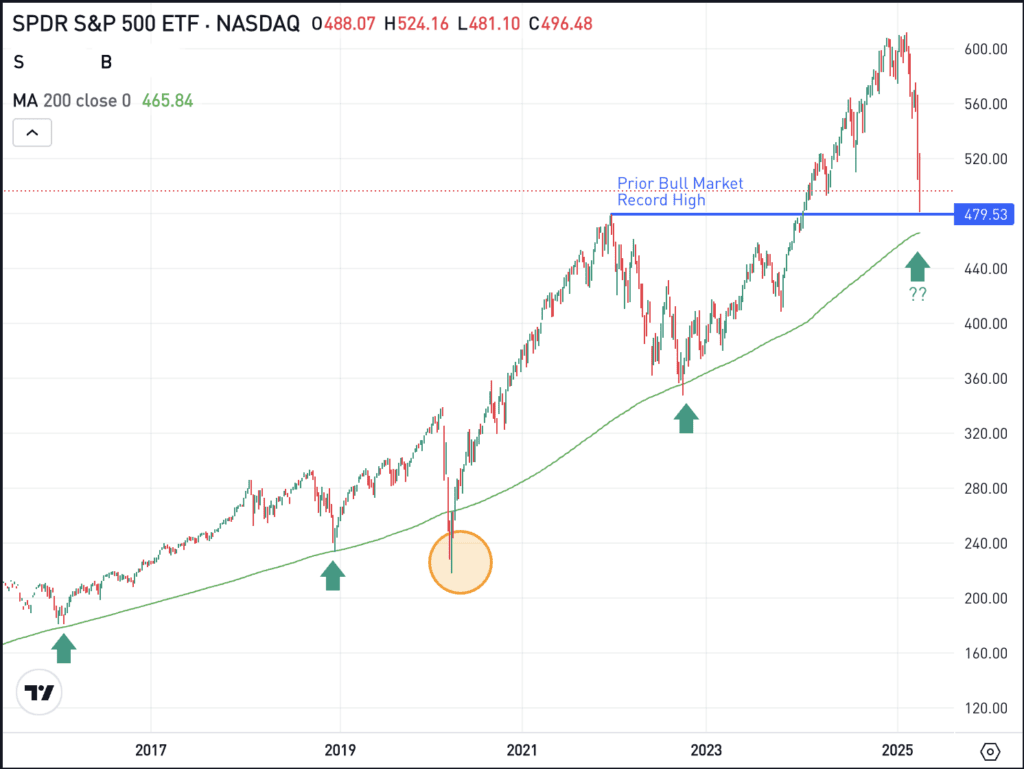
Also notice how SPY has consistently found support near the 200-week moving average. The one exception of the last decade was 2020, when the Covid panic sent the ETF below this mark for several weeks before a violent rebound higher.
At current levels, the SPY would need to decline about 6% to test this level. We don’t know that it will test this measure (either soon or in the next few weeks or months) or that it will be support if it does test it.
But we do know that the combination of the prior bull market highs and the 200-week moving average could give investors a reason to nibble the dip.
For long-term fundamental traders, buying into such a hefty pullback could prove rewarding down the stretch, even if there is more downside in the short term, while technical traders could find an attractive risk/reward setup in that scenario — although again, neither is guaranteed a profit.
What Wall Street is watching
TLT – Bonds are in focus as yields push higher today. The decline in bonds has some investors worried about a larger unwind, while others are focused on the decline in what has been an effective safe-haven asset so far this year. To keep an eye on bonds, consider a chart for the TLT ETF.
NVDA – Shares of Nvidia hit a 2025 low of $86.62 on Monday, before a strong bounce sent the stock to nearly $106 on Tuesday — a rebound of more than 20%. Investors are hoping the stock can continue to find momentum, as shares are higher in this morning’s pre-market session, although volatility is likely to stay elevated in the short term.
Disclaimer:
Please note that due to market volatility, some of the prices may have already been reached and scenarios played out.