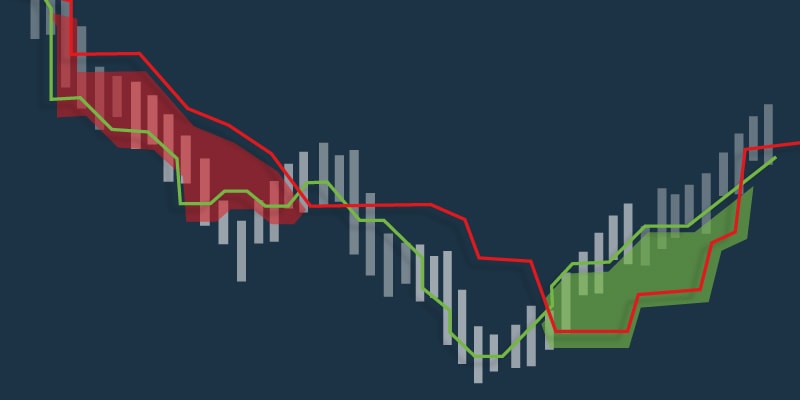
Technical analysis is, without a doubt, one of the key practices utilized by traders around the world. In recent years, the abundance of chart data, coupled with growing access to professional-level tools and reliable information, has made the practice even more popular. Numerous traders, both professional and amateur, perform technical analysis on a daily basis and base their trading decisions on these models.
Technical analysis is an extremely vast field and there are many different techniques and styles to master. However, with the rise of cryptocurrency trading, some tools have become more popular than others. While there are various metrics leveraged by traders to identify market opportunities, we’ve gathered three of the more popular ones:
1 – Fibonacci (Retracements)
Like all forms of technical analysis, Fibonacci is used to identify a certain pattern. Specifically, it is used to determine the potential high and low points of a certain crypto’s price. Fibonacci is a sequence of numbers in which each number is the sum of the two previous numbers. The basic Fibonacci scale is 1,1,2,3,5,8,13,21, and so on.
When analyzing a chart, technical analysts will identify two extreme points, i.e., a maximum price and a minimum price, and divide the distances between them using Fibonacci ratios: 23.6%, 38.2%, 50%, 61.8% and 100%. The technique is based on the assumption that the boundaries of each segment represent a potential reversal point, in which the pattern from the previous segment will be replicated.

2 – Ichimoku Clouds
An Ichimoku Cloud is a graphic representation overlaid on a certain cryptocurrency’s chart. The outline resembles a cloud, hence the name. Ichimoku Clouds are created by outlining two kinds of moving averages in a crypto’s chart and then projecting that cloud on a predetermined time frame in the chart’s future. The cloud is used to identify support and resistance points, momentum and trends. If the cloud is green, it means the market is bullish; if it’s red, then the market is bearish.

Traditionally, the analysis is completed by outlining the last 52 time periods (hourly, daily, weekly etc.) and then moving it forward 26 time periods. This creates a projection that is relevant to an amount of time that is half the size of the original plotted cloud. The resulting cloud is used as a reference for identifying buying and selling points, serving as an additional indicator alongside the current moving averages.
3 – RSI (Relative Strength Index)
The Relative Strength Index (RSI) is a momentum indicator, using an oscillator to determine whether a certain asset is currently being overbought or oversold. An asset that is overbought is likely to show a price decrease in the near future, while an asset that is oversold will most likely go up in price. The RSI is calculated on a scale of 1 to 100, when traditionally, a score of over 70 is indicative of an asset being overbought, while a score of below 30 indicates the opposite.
To calculate the RSI, analysts use an asset’s price history over a certain period of time, calculating its relative strength by determining the relationship between positive and negative closes and the number of points lost or gained each time. The standard for creating an RSI is 14 time periods, but it is in no way binding, and other sets of time periods are also quite common. The advantage of RSI is that it can give a clear signal as to the turning points of the market. However, any index score between the 30 and 70 range doesn’t really offer any significant actionable data.

There are many other techniques and metrics used by technical analysts and, when it comes to technical analysis tools, the three above represent only the tip of the iceberg. However, by mastering the three and combining them, traders may be able to achieve a higher degree of certainty when making financial decisions.
Transacting in virtual currencies is subject to various risks, such as price volatility, and is, therefore, not suitable for everyone. Your capital is at risk

