

Bearish sentiment is at one of its highest levels since 2000 despite stocks’ minor dip from record highs. The Daily Breakdown digs in.
Friday’s TLDR
- Sentiment is incredibly bearish
- Can the market bottom?
- Bonds finding a groove
The Bottom Line + Daily Breakdown
We’re almost two months into 2025 and it’s been a bumpy ride. The S&P 500 is about flat on the year and down about 2% over the past three months. The sugar high we saw immediately after the election has worn off as stocks, consumer confidence, and sentiment have all come under pressure.
Speaking on that last note — sentiment — we’ve seen quite an interesting development. There are a few sentiment readings out there, like the NAAIM, the CNN “Fear & Greed” Index, and the AAII survey. (Feel free to bookmark these for the future, too).
For today’s discussion, I’ll be focusing on the bull and bear sentiment surveys from AAII, starting with the bulls:
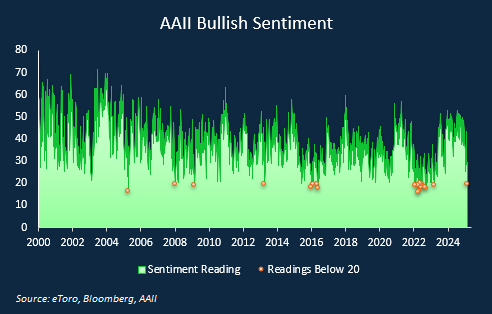
Since 2000, the lowest bull reading was 15.8, while this week rang in at 19.4. Readings below 20 tend to come into play near a trough in sentiment.
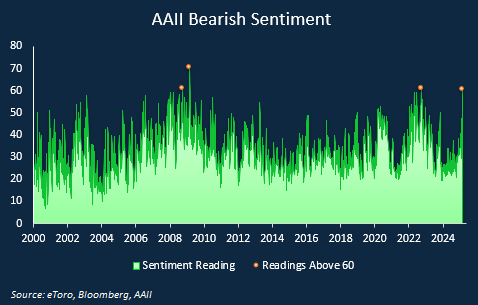
On the flip side, bearish sentiment tends to spike during times of uncertainty. Notice how prior spikes above 60 happened near the depths of the financial crisis, the lows of the 2022 bear market…and right now:
Sentiment extremes tend to act as contrarian indicators. Meaning that when we have a “washout” in sentiment — where bullish readings are really low and bearish readings are really high — stocks tend to form a bottom.
(The opposite can be true on the upside, too. When bullish readings get toward an extreme high and bearish readings near an extreme low, markets tend to top and pull back).
The interesting thing here is, the S&P 500 was about 3% off its all-time high when this week’s survey was released. That’s not something we tend to see when sentiment is this low.
Making Sense of the Senseless
It’s hard to say what exactly is driving this response, but a few things stick out. First, even though 9 of the S&P 500’s 11 sectors are positive on the year, the two sectors that are lower — tech and consumer discretionary — are major holdings for investors.
If they’re doing bad, of course sentiment is taking a hit.
Second, economic policy uncertainty is soaring. In the US, this measure is at its third highest level since 2000, with only the financial crisis and Covid coming in higher. Globally, it’s the highest it’s been since Covid…and it’s close to surpassing that figure right now.
The back-and-forth tariff threats are wearing on investors, even if they have been more bark than bite thus far.
The Bottom Line
With sentiment nearing an extreme, keep an eye on markets to see if stocks and crypto can find their footing. If they can, let’s see what type of rally develops. If they can’t, it’s possible that sentiment remains dampened and creates a sort of self-fulling prophecy via lower prices.
Want to receive these insights straight to your inbox?
The setup — Bonds
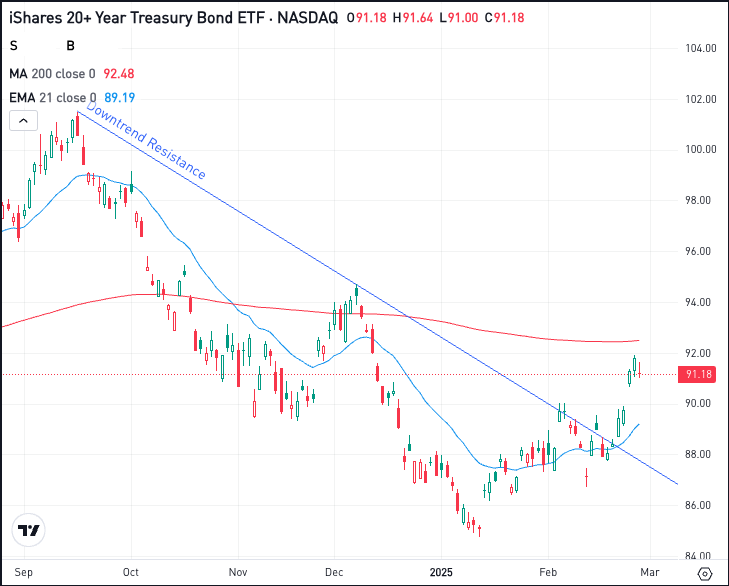
One of the most-traded bond ETFs is the TLT, which has been in demand in recent trading. In fact, it’s up about 4.5% so far this year and has had some recent pep in its step after breaking out over downtrend resistance.
That said, there’s no sugarcoating it: The TLT has struggled over the longer term and is down almost 2% over the past year. Note that the TLT is still below its 200-day moving average (in red).
As yields have come under pressure, rate-sensitive assets like bonds, dividend stocks, and REITs have enjoyed recent gains.
Some active investors may prefer a minor pullback first — which is fine — but so long as TLT can stay above the $87 to $88 area, bulls could maintain recent momentum. For sustained momentum though, they’ll need to see TLT regain the 200-day moving average.
On the downside, a break of $87 to $88 could open up TLT to more selling pressure.
Options
For some investors, options could be one alternative to speculate on TLT. Remember, the risk for options buyers is tied to the premium paid for the option — and losing the premium is the full risk.
Bulls can utilize calls or call spreads to speculate on further upside, while bears can use puts or put spreads to speculate on the gains fizzling out and TLT rolling over.
For those looking to learn more about options, consider visiting the eToro Academy.
Disclaimer:
Please note that due to market volatility, some of the prices may have already been reached and scenarios played out.