

The Daily Breakdown looks at the latest escalation in the global trade war and one that is specifically hitting chip stocks like Nvidia.
Wednesday’s TLDR
- Nvidia, ASML weigh on tech
- A technical look at the S&P 500
- Gold set for record highs
What’s happening?
Shares of Nvidia are moving lower this morning, falling more than 6% in pre-market trading. The news comes after the company warned about taking a charge of roughly $5.5 billion in its fiscal Q1 due to new chip restrictions from the Trump Administration.
Like China’s reported actions towards Boeing, this again serves as a reminder that the trade war is — unfortunately — alive and well between the US and China.
Last week, bond prices began to unravel, all but forcing the Trump Administration to tone down its trade-war rhetoric, resulting in a 90-day pause. That pause affected just about every country on Trump’s list, with the exception of China.
Stocks erupted higher on news of the pause, but this week serves as a stark reminder that the world’s two largest economies continue to spar. It also serves as a reminder that the bond market — not the stock market — has the power to change the Administration’s mind.
For Nvidia specifically, shares are still well off the recent lows near $86. Despite renewed trade-war worries, bulls are hoping shares can stay above $100 and certainly hope the stock can avoid retesting the recent lows.
Want to receive these insights straight to your inbox?
The setup — S&P 500
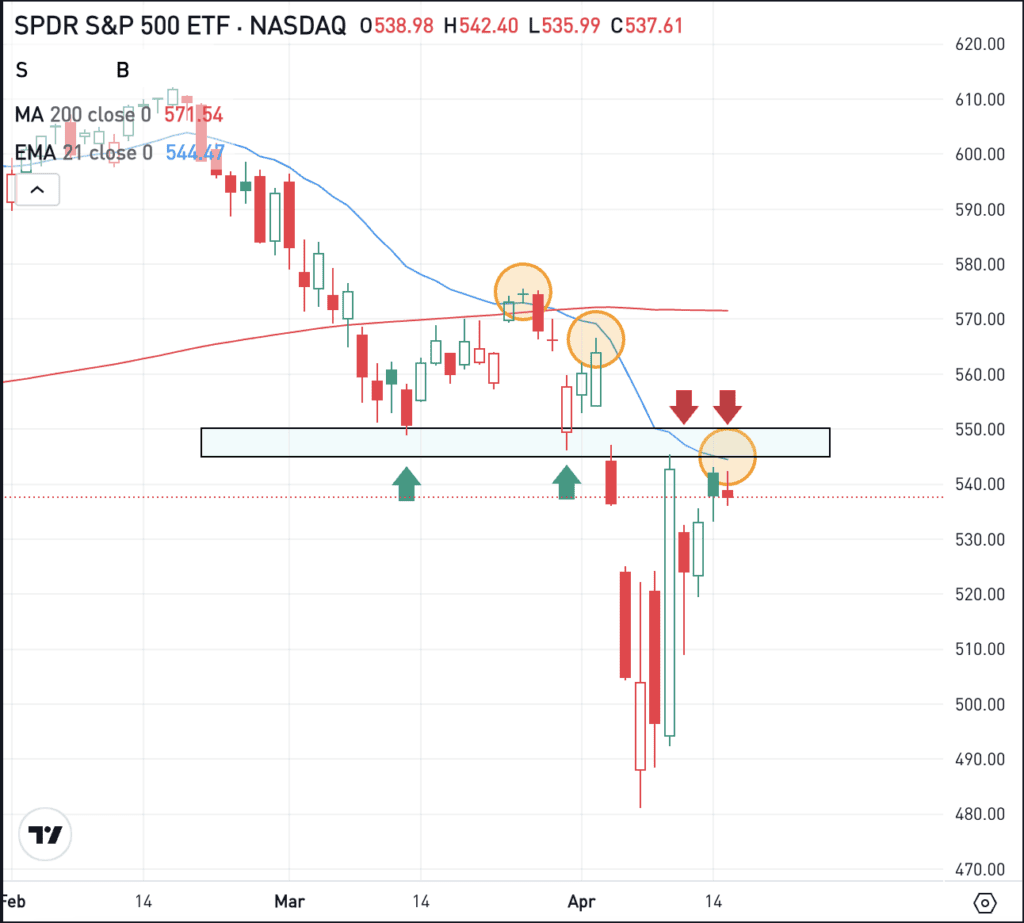
One thing that’s nice about technical analysis? Investors can simply observe price action without having a bias. I generally look at the markets through a bullish lens, but when we look at the S&P 500 ETF — SPY — we can be honest about what the market is doing.
For instance, when we look at the daily chart below, we can see that the declining 21-day moving average (the blue line) has been acting as resistance. We can also see that the $545 to $550 zone (the blue box) was an area of support in March, but now it’s acting as resistance.
These are simple yet honest observations. They don’t mean that investors have to be bearish or sell all of their stocks. But it does mean that investors should be aware of the current situation, the potential risks, and what needs to happen for it to look more bullish.
Here’s how I see it.
The recent bounce has been a welcomed reprieve, but it will have trouble sustaining momentum so long as the above observations are true — that being that SPY remains below the 21-day moving average and the $545 to $550 zone.
If SPY is able to regain these measures, then more upside potential is possible. However, if it cannot do so, then it remains vulnerable to more downside. Remember, it was recently as low as $481.80.
How to Approach This
For some investors, this may mean nothing. For others, it might put them in a more defensive position, such as lightening up on positions, taking short-term profits, or hedging.
If hedging, puts or put spreads could be one way to take advantage of a deeper pullback in the SPY.
Remember, implied volatility or “IV” is a component to options pricing. The higher the IV, the more expensive options become. Right now, IV is pretty elevated because volatility is high, and spreads are one way to help mitigate the costs of higher volatility.
For those looking to learn more about options, consider visiting the eToro Academy.
What Wall Street is watching
ASML – Shares of ASML are slightly lower this morning, down about 4% in pre-market trading after the firm reported its quarterly results. While earnings and revenue are usually the main focus, this time it was orders, which missed analysts’ expectations as management said tariffs have “increased uncertainty” and weighed on demand.
INTC – Like other chip stocks, Intel is under pressure this morning. However, shares have found support in the $18 to $20 range over the past few quarters. Bulls are wondering if this will continue to be the case or if shares will break lower. Check out the chart for INTC.
GOLD – Gold prices are bursting higher this morning, up several percent and trading at new record highs. Meanwhile, the GLD ETF is trading higher in the pre-market session as well, and if it opens near these levels, it too should be set for record highs as gold remains a top safe-haven play amid continued geopolitical tension.
Disclaimer:
Please note that due to market volatility, some of the prices may have already been reached and scenarios played out.