

The Daily Breakdown takes a technical look at the S&P 500, which is on the verge of a 10% correction amid elevated volatility.
Tuesday’s TLDR
- Finding the silver linings
- This pullback is normal (so far)
- Gold continues to shine
What’s happening?
The S&P 500 and Nasdaq 100 had their worst day of the selloff yesterday. Despite a late-day bounce, it did little to provide relief for investors as the S&P slumped 2.7% and the Nasdaq 100 tumbled 3.8%. It didn’t help that Bitcoin made new year-to-date lows, either.
So it’s probably time for some silver linings, right?
We have talked a lot about diversification and hedging in these environments, but the simple truth is, we’re still within the parameters of a “normal” pullback.
The S&P 500 is down 8.6% from its closing high on February 19th and has suffered a peak-to-trough decline of 9.5%. Going back to 1974, the index has averaged three declines a year of 5% or more, with the average intra-year dip weighing in at around 14%.
So while painful, this is pretty normal — so far.
Another silver lining: How many investors wanted to buy a pullback in 2024 and didn’t get one? If someone waited to buy a 10% correction last year, they missed out on a gain of more than 20% in the index, all while waiting for a dip that never materialized.
So while this latest action has been tough, long-term investors are getting better prices as they continue to average into the market and/or buy individual stocks and sectors that have fallen even more.
Want to receive these insights straight to your inbox?
The setup — S&P 500 ETF
We just talked about the normalcy of the current dip, but those are just statistics. Let’s look at the charts for the S&P 500 ETF, the SPY.
A lot of significance comes into play near the current $565 level. That was major resistance until the SPY was able to break out in late September.
The ETF is now testing down into that area now, along with the rising 50-week moving average.
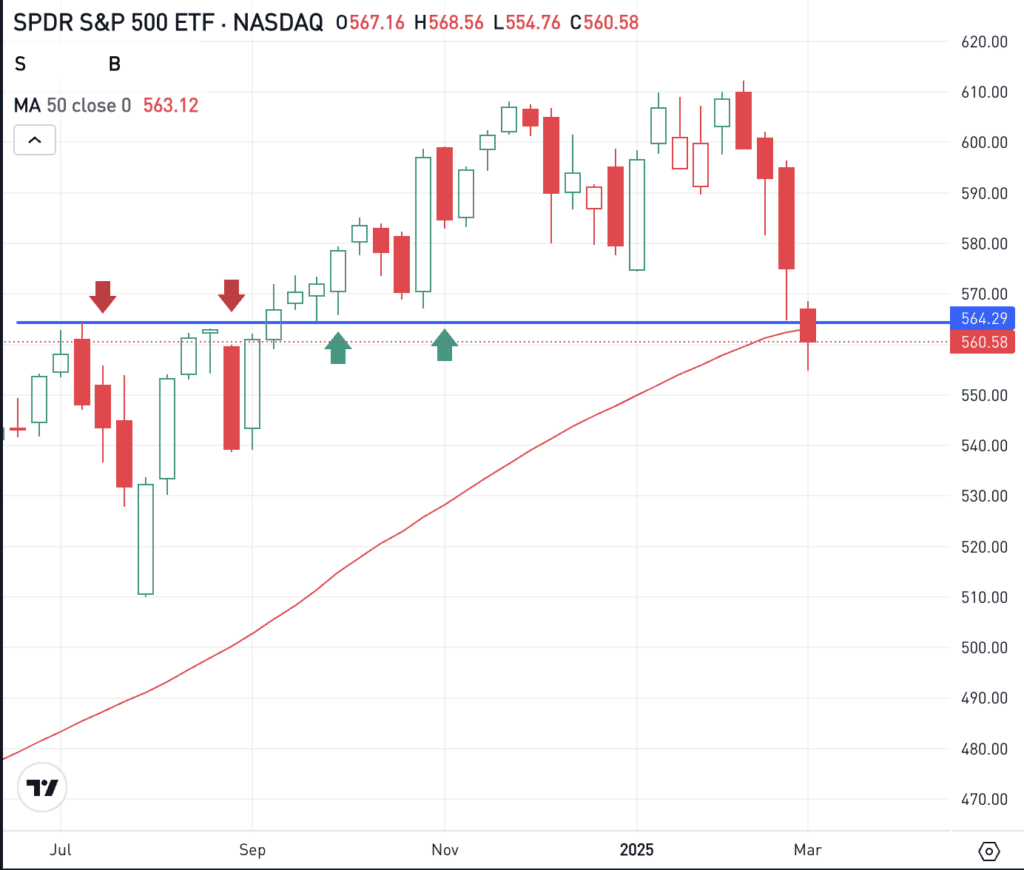
Bullish technical traders would really like to see the SPY make a stand here, especially after falling nearly 10% from the highs and declining in each of the last three weeks. If support holds, we could see a larger relief rally in the coming days or weeks.
However, if support fails, bearish momentum could continue as the rallies continue to fail and the market continues to make new lows.
Options
For options traders, calls or bull call spreads could be one way to speculate on support holding. In this scenario, options buyers limit their risk to the price paid for the calls or call spreads, while trying to capitalize on a bounce in the stock.
Conversely, investors who expect support to fail could speculate with puts or put spreads.
For those looking to learn more about options, consider visiting the eToro Academy.
What Wall Street is watching
TSLA – Shares of Tesla were hammered on Monday, falling more than 15%. The stock is now down more than 50% from its record high in December and has given up all of its post-election gains. In fact, Tesla has declined in seven straight weeks thus far. You can look at Tesla’s chart.
KSS – Shares of Kohl’s are under pressure, falling more than 15% in pre-market trading after the firm delivered disappointing earnings. Sales declined 9.4% year over year but were in-line with expectations, however, guidance was the major disappointment.
GLD – The gold ETF — GLD — slipped on Monday, but is rallying on Tuesday morning as the safe-haven asset remains a go-to for investors. The GLD is up roughly 10% so far on the year and boasts a one-year return of about 32%.
Disclaimer:
Please note that due to market volatility, some of the prices may have already been reached and scenarios played out.