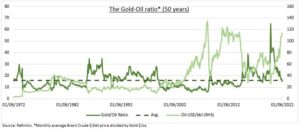
GOLD-OIL RATIO: Gold has disappointed this year, even as its traditional inflation and risk aversion catalysts have surged. Whilst oil prices have soared. The gold-oil relative value ratio (see chart) shows the barrels of oil needed to buy an ounce of gold. It is back to neutral levels, and an 8-year low. This implies less gold valuation pressure. Especially when combined with the outlook for less US dollar and 10-year bond yield headwinds; a message from copper/gold ratio. But our preference remains high-for-longer oil prices, with tight supply offsetting slower demand.
GOLD: Investor demand for gold (GLD) been sapped by safer-haven competition from rising US 10-year bond yields, compared to no income gold with its high cost-of-carry. The strong US dollar has also made gold pricier for key overseas buyers, like India. The 1970’s inflation-hedge parallels are also lessened by the more credible central banks and more anchored inflation expectations. Flat physical gold prices have also held back equities (@GoldWorldWide, GDX) and majors like Newmont (NEM), that have the operating leverage to benefit from higher prices.
OIL: We see high-for-longer oil prices, resilient but not immune to the global growth slowdown and the strong US dollar. They are supported by 1) a reopening Chinese economy, the biggest importer. 2) Tight supply, with global drill rigs still -55% from highs. 3) Continued inflation-hedge investor demand, with 8% US and EU inflation. 4) A ‘backwardated’ market with lower futures prices incentivizing production today. We prefer oil equities (XLE, @OilWorldWide) over physical (USO), given low cash flow break-evens, cheapest sector valuations, and high dividend yields.

All data, figures & charts are valid as of 22/06/2022

