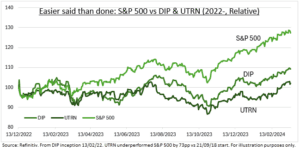
TURNAROUNDS: Charlie Munger of Berkshire Hathaway (BRK.b) once said turning around a struggling business was ten-times harder than people think. Yet it is one of the most popular investment strategies for retail investors. Given their craving for a perceived deal and their longer-term investment outlook. There are many potential turnarounds front and centre today. From Paypal (PYPL) to Cisco (CSCO), and Intel (INTC) to Boeing (BA), to name just a few. Yet the data tends to back up Munger. With stocks falling for a good reason, and turnarounds tough to quickly execute. ETFs following a stock turnaround strategy have done poorly (see chart). More interestingly, the equivalent in the corporate bond market has performed much better.
BUYING DIP: We look at two stock ETFs that have ‘buy the dip’ turnaround strategies. They are both tiny, relatively new, and US and short term focused. And performed poorly. BTD Capital Fund (DIP) uses AI to highlight short-term opportunities. Its largest positions are Universal Health (UHS), Newmont Mining (NEM), Crown Castle (CCI). Whilst the Vesper US Large Cap Short Term Reversal Strategy ETF (UTRN) looks for rebounds among the worst performers the prior week. Its largest holdings are Lennar (LEN), Akamai (AKAM), DR Horton (DHI). Retail investor strategies may be longer term and less systematic, but this performance is a warning.
FALLEN ANGELS: We also looked at the ‘fallen angels’ strategy in corporate bonds. Buying the bonds of companies downgraded from investment grade to junk. The two largest ETFs tracking this are larger, longer standing, and both outperformed the high yield index (JNK). The VanEck Fallen Angel High Yield Bond ETF (ANGL) by 33%, since 2012, and iShares Fallen Angels ETF (FALN) by 16%, since 2016. The theory is that as a downgraded bond transitions from investment grade to high yield, there is a natural ownership switch. From those averse to default risk to those more accustomed to it. This transition creates credit mispricing and opportunity.

All data, figures & charts are valid as of 18/03/2024.


