


Airbnb Overview
Airbnb ($ABNB) connects travellers with unique accommodations and experiences worldwide, competing with Booking.com and Expedia’s Vrbo. The stock is trading around $117, with a 52-week high of $170 and a low of $110. It has a market cap of $74.5 billion and trades at a P/E ratio of 15.9x. Insider ownership remains strong, with over 79% voting power.
However, since its Q2 2024 earnings report on August 6, 2024, the company’s share price has dropped by over 13%, prompting many investors to reassess whether the stock represents a good investment opportunity.
Let’s find out!
Quarterly Performance
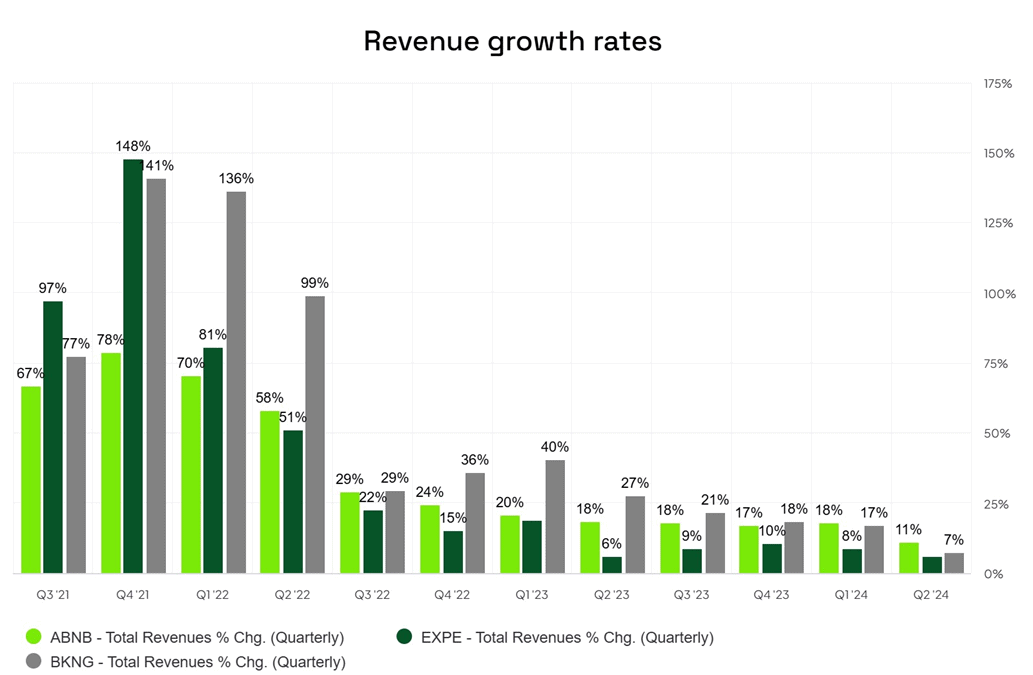
- Revenue: Airbnb reported $2.75 billion in revenue, an 11% year-over-year increase, beating estimates and guidance. This growth rate surpasses Expedia’s ($EXPE) 6% and Booking’s ($BKNG) 7.3%.
Source: Finchat.io
- Adjusted EBITDA Margin: Dropped to 32.5% from 33% due to marketing expenses.
- Income from Operations: $497 million, down from $523 million last year, reflecting a ~300bps decline in EBIT margin to 18.1% mainly due to higher stock based compensation costs.
- Net Income: $555 million, a 14.6% decrease from $650 million in Q2 2023, due to higher taxes. GAAP EPS was $0.86, below estimates of $0.95.
- Balance Sheet: Strong with $11.3 billion in cash & cash equivalents and $2 billion in debt. Free Cash Flow (FCF) was $1 billion, up $143 million from last year and a FCF margin of 38%.
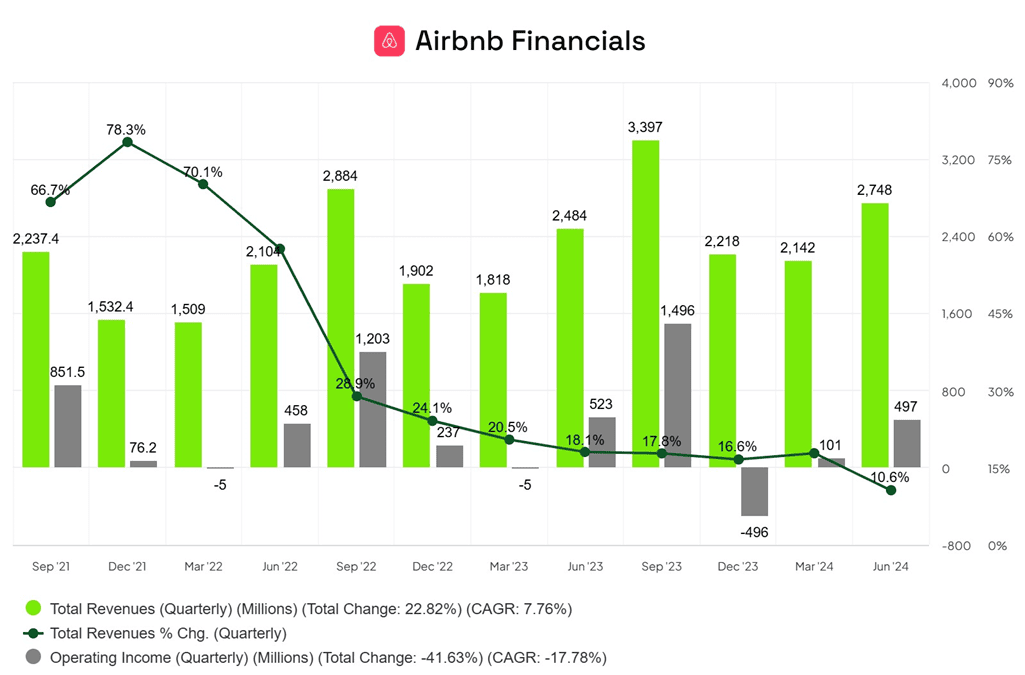
Source: Finchat.io
Key Performance Indicators (KPIs)
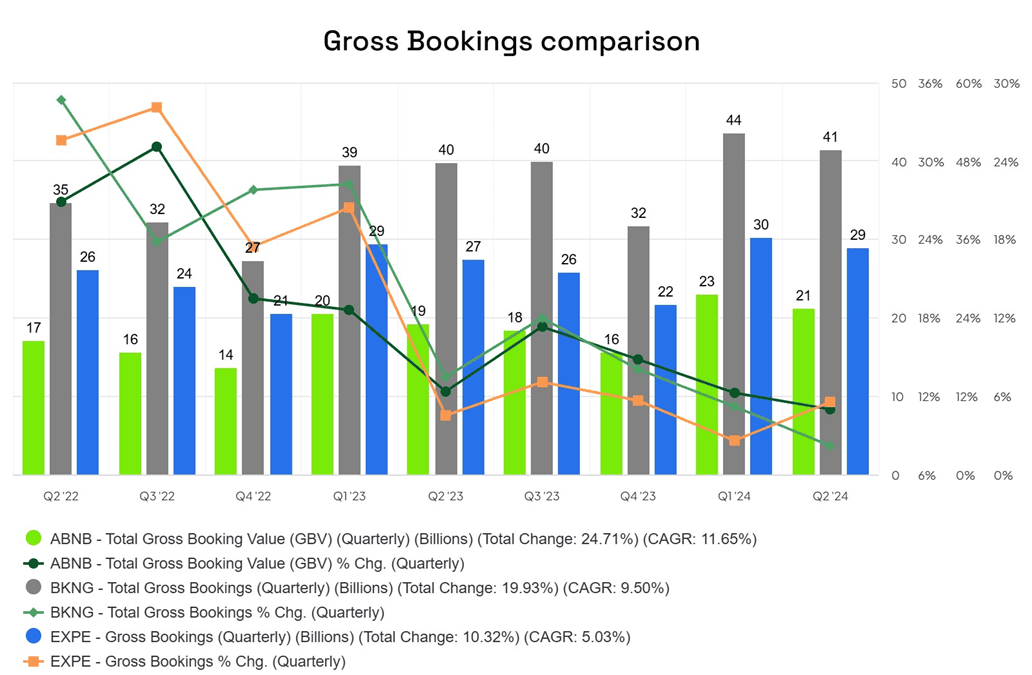
- Gross Bookings Value (GBV) hit $21.2 billion, up 11% YoY.
- Nights and Experiences totalled 125.1 million, grew by 9% with strong growth in Asia-Pacific (19%) and Latin America (17%). Meanwhile, ADR marginally improved by 2% due to mix and price increases.
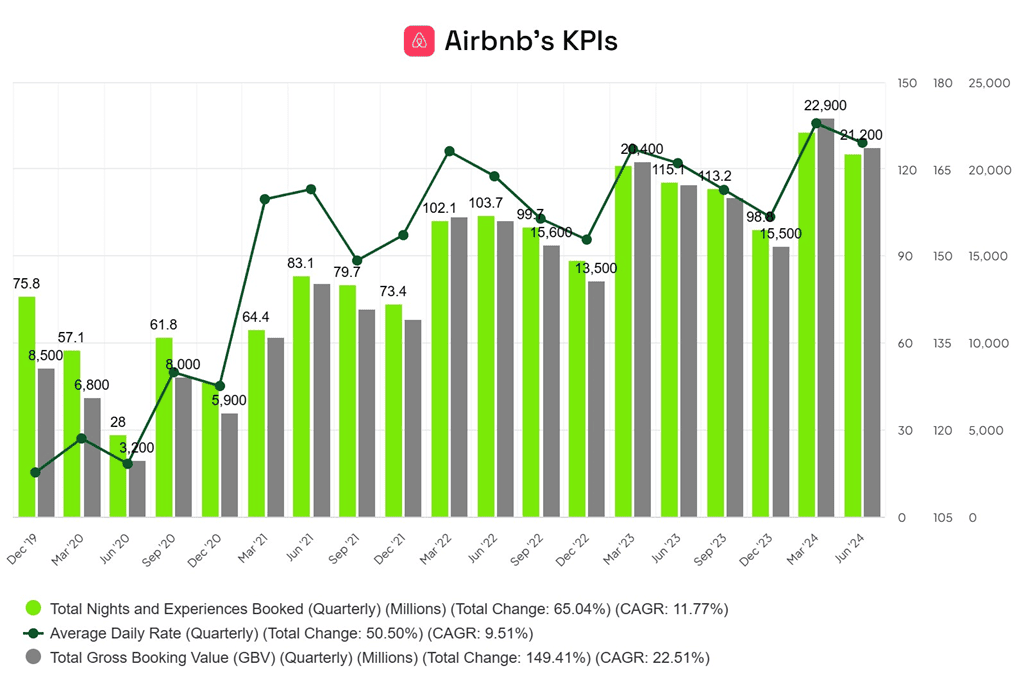
Source: Finchat.io
- In comparison, Booking’s GBV grew 4% with a 3% drop in ADR, while Expedia’s booked room nights increased by 10.3%, and gross bookings rose by 5.5%. From the chart below, it’s clear that the three key players generally move in tandem, though there are some deviations in their quarterly growth rates.
Source: Finchat.io
- Active Listings: Exceeded 8 million, a 15% YoY increase. Listings managed by SuperHosts grew by 26%, and 200,000 listings were removed since April 2023 to improve quality. In comparison, Booking’s alternative accommodation listings reached 7.8 million and grew by 12%.
Other Highlights
- Airbnb Icons: Launched in May 2024, featuring exclusive experiences. Despite 850 million impressions, its revenue impact remains uncertain.
- Share Repurchases: $2.75 billion repurchased in the past year, reducing share count by 1.9% (from 686M in Q2’23 to 673M in Q2’24). $5.25 billion remains in repurchase authorization. Although buybacks are positive, when done at the right price, much of this activity is aimed at offsetting dilution from SBC.
- Mobile App: In Q2 2024, nights booked through Airbnb’s mobile app rose 19% YoY to 55% of total bookings (50% in Q2’23), compared to 53% (47% in Q2’23) for Booking.com. This growth reflects both companies’ adaptation to customer trends and enhancements like Airbnb’s WeChat mini-app and simplified sign-ups.
- Future Actions:
a) A new host service will launch in October to connect people with homes but no time and those with time but no homes. This is expected to increase Airbnb’s inventory.
b) The relaunch of experiences is planned for 2025 to increase awareness.
c) Expansion of long-term stays, which currently represent 17% of nights booked.
d) Further penetration into underpenetrated markets, with significant growth potential beyond the currently most penetrated regions: the U.S., UK, France, Canada, and Australia.
“We’re now beginning to prepare the next chapter of Airbnb […] We’re going to have multiple new products and multiple new services.” – Brian Chesky, Co-founder & CEO
“Listen, we want to be growing a lot faster than we are. We want to be growing in healthy double-digit growth, and I think we can.” – Brian Chesky, Co-founder & CEO
Q3 2024 Outlook
- Revenues: Expected between $3.67B and $3.73B, reflecting 8%-10% YoY growth.
- Nights and Experiences: Growth forecasted around 5.5%, based on own estimates, down from 9% in Q2.
- ADR: Projected to rise modestly, say by 2%, with an anticipated GBV of $19.7B representing a growth of 7.6% and a take rate of 18.8% (Vs 18.6% in Q3’23).
- Adjusted EBITDA: Expected to be flat year-over-year in nominal terms but with a reduced margin of ~50%, down from 54%.
- Full-Year Adjusted EBITDA Margin: Expected to be around 35%, 180bps lower than 2023.
- Stock-Based Compensation (SBC): Projected to increase by 20%-25%, raising the SBC/Sales ratio to 12.6%.
- Tax Rate: Anticipated to be in the high teens.
Risks
- Short-term: Revenue growth may decelerate further due to macroeconomic challenges leading to reduced travel. This could negatively impact Airbnb’s share price.
- Long-term: Regulation poses the biggest challenge.
- Short-term rentals: New York’s strict laws implemented in September 2023, led to an 80% drop in Airbnb listings, per the New York Post. While New York contributed just 1% of Airbnb’s global revenue, broader implementation of such laws poses a risk.
- Taxes: Last year, Airbnb agreed to pay $621 million in taxes to Italian authorities. Similar developments in other countries could impact future cash flows and profitability, but the company has the resources to manage such situations effectively.
Valuation
Currently, Airbnb trades at a 24.8x EV/EBITDA multiple (adjusted for SBC), which seems high given the projected 9% revenue growth rate for the next quarter and a 5-year CAGR of 10.9%. While the company’s growth prospects and margin expansion are promising—thanks to operating leverage and the expected decrease in SBC as a percentage of revenue post-2025—this multiple appears steep compared to Expedia’s ~10x and Booking’s ~18x, the latter of which is often seen as a benchmark for margins and shareholder returns.
I believe Airbnb’s multiple may contract further as growth slows or, at best, stabilize at current levels, suggesting the stock may not be undervalued. Additionally, while its TTM free cash flow yield of 5.9% might seem appealing, adjusting for SBC (treated as cash due to its dilutive impact) reduces the free cash flow yield to 4.2%, implying a FCF multiple of 24x, which is relatively reasonable.
Conclusion
The quarterly performance was solid, and Airbnb’s business model remains robust. However, industry-wide slowdowns and a below-expectations outlook led to a sharp decline in the stock price. Nonetheless, the current price does not indicate a bargain. Therefore, I am maintaining my 2% position and will watch for a more favorable price to increase my stake