


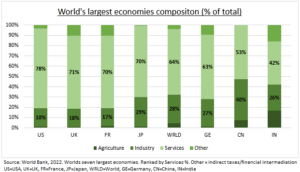
STRUCTURE: Understanding how different economies are structured matters. Just as how much debt they have, and how it is organized, does. The consumer dominates the US, UK, and French economies. Whilst the industrial sectors are disproportionately important in China and Germany (see chart). Global growth is heading for a soft-landing, with latest PMIs consistent with sluggish but resilient 1.5% growth. But the divergence between improving services and the manufacturing recession is widening. This is reassuring today for the US and its super-sized stock market. Whilst keeping pressure on German (DAX) and Chinese (MCHI) assets. But is also accelerating the likely policy response, and a potentially powerful cyclical profits recovery.
SERVICES The consumer and services have been the positive economic surprise of the past year. Helping keep the US and UK out of a much-telegraphed recession. Jobs markets have stayed tight, with unemployment rates near record lows. Whilst falling inflation has supported real wage growth and spending. Less positively this has also led to some stickiness in inflation, particularly in the UK, which still has among the world’s highest core price rises. Latest PMIs show services heavy segments like tech, healthcare, and tourism are the global growth leaders. We look to Today’s flash PMIs of January for the latest growth and inflation health-check..
INDUSTRY: Whilst the global manufacturing downturn is worsening. This has pushed Germany into recession and helped drive China’s recent growth disappointment. The global leading PMI indicators have fallen for seven months, with manufacturers now trimming staff numbers and input purchases. It has also driven downside surprises to inflation, with China flirting with deflation. The PMIs show manufacturing heavy segments like forest products, mining, and construction materials are the global laggards. This is all negative for now. But is also accelerating the policy response that will ultimately drive a likely sharp cyclical recovery.
All data, figures & charts are valid as of 23/01/2024.