


REBOUND RISK: Risk of an inflation comeback is under-priced and rising. With the US labour market surprisingly healthy and economic growth strong. The Q1 GDP NOWCast is an above average 3.4%. 10-year bond yields are up, Fed rate cut hopes pushed back, and US dollar the best performing major currency this year. Stocks welcomed the lower recession risk and firmer profits outlook. But may be under-pricing the tail-risk of an inflation upside surprise. It’s the most important number in markets, the biggest investment risk, and our inflation tracker (see below) is now flashing yellow. A first sub-3% headline inflation print is needed from today’s January report to validate the benign consensus of a productivity-boom driven ‘immaculate disinflation’.
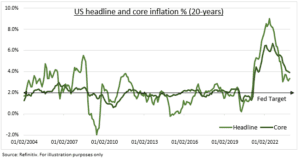
NOWCAST: The Cleveland Fed NOWCast is showing a reassuring inflation ease this month. With the headline increase cooling sharply to +0.2% MoM and +2.9% YoY. Likely driven by easing gasoline, food, and used car prices. This would be the first 2%-handle this cycle and a number not seen in 33 months. Whilst core prices, excluding energy and food, are seen edging lower to 3.8%. The NOWCast also sees further inflation easing next month. This lower prices outlook is also supported by the Truflation measure at an even lower 1.4%. This is an innovative real-time blockchain-driven tracker of inflation from 30+ data sources and 13+ million prices.
TRACKER: But our tracker of 13 leading and coincident indicators shows a stalling of price falls. It’s -40% from peak 2022 levels but +4% the past month. With large gains in forward-looking PMI employment and price indicators, alongside a firming housing market and Red sea driven supply chains. This was only partly offset by lower used car prices and consumer inflation expectations. We track labour (employment ISM, JOLTS), housing (Zillow rent, NAHB index), goods (Used cars, Manufacturing ISM prices), commodities (Gasoline, broad commodities), supply chains (GSCP index, container rates), and expectations (Michigan survey, Break-evens).
All data, figures & charts are valid as of 12/02/2024.