


MARKET: US stocks have had a strong start to the year. And powered straight through some mounting headwinds. With interest rate cut expectations now pushed back. And US valuations above 20x P/E. Better-than-expected Q4 earnings have been a fundamental driver. Whilst still relatively cautious investor sentiment has remained a big technical support. Our retail investor survey shows these technicals are often as important as fundamentals for many. And helped drive buy-the-dip behaviour by many still overly cautious investors. Our investor sentiment index is ‘neutral’, and held back by fund outflows and still average retail sentiment and put/call levels.
SENTIMENT: Three of our four sentiment index measures are still low(ish). Mutual funds and ETFs seeing outflows. The equity put/call ratio is still only at its long-term average. 42% of retail investors are bullish, only modestly above average. With the VIX at 14 the sentiment outlier, close to all-time lows and well under its average of 20. Broader measures are as mixed. The BAML fund manager survey shows institutional sentiment above March 2023 SVB bank crisis lows but only long term average. But big-tech stocks the most crowded trade and cash down to 4.2%. The NAAIM index shows hedge funds 93% net long and closing on the 102% Dec. high.
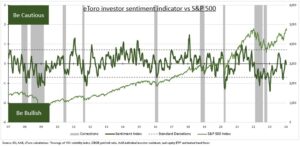
INDICATOR: Our proprietary eToro investor sentiment indicator tracks the VIX, fund flows, retail sentiment, and the put/call ratio. A low number is contrarian bullish, with more investors left to turn positive the market. Whilst a high number is a signal for contrarian caution, with investors already bullish. It’s typically been a better buy than sell signal. It is specifically made of 1) Equity mutual fund and exchange traded fund (ETF) flows. 2) Long-running American Association of Individual Investors (AAII) sentiment survey. 3) The VIX index of expected 30- day S&P 500 volatility. 4) S&P 500 put/call ratio, proportion of put buying (option to sell) vs calls (to buy).
All data, figures & charts are valid as of 14/02/2024.