


We love predictions… What will happen in the future? Finding the answer to this question is inherent to us as humans, as we want to avoid uncertainty as much as possible.
The yield curve analysis is a fascinating subject often used as an indicator to signal economic slowdowns. But what exactly is it, and why should you care?
Simply put, the yield curve is a chart that plots interest rates of bonds of different maturities. When the curve inverts, short-term interest rates become higher than long-term ones. This has historically foreshadowed economic downturns.
What Is Yield Curve Inversion?
The yield curve is a graphical representation of interest rates across different bond maturities. The normal expectation is that bonds with longer maturities will receive higher interest rates.
This compensates investors for the different risks involved in lending out their money. The longer the period, the bigger the risks of inflation, economic uncertainty, and credit default becomes.
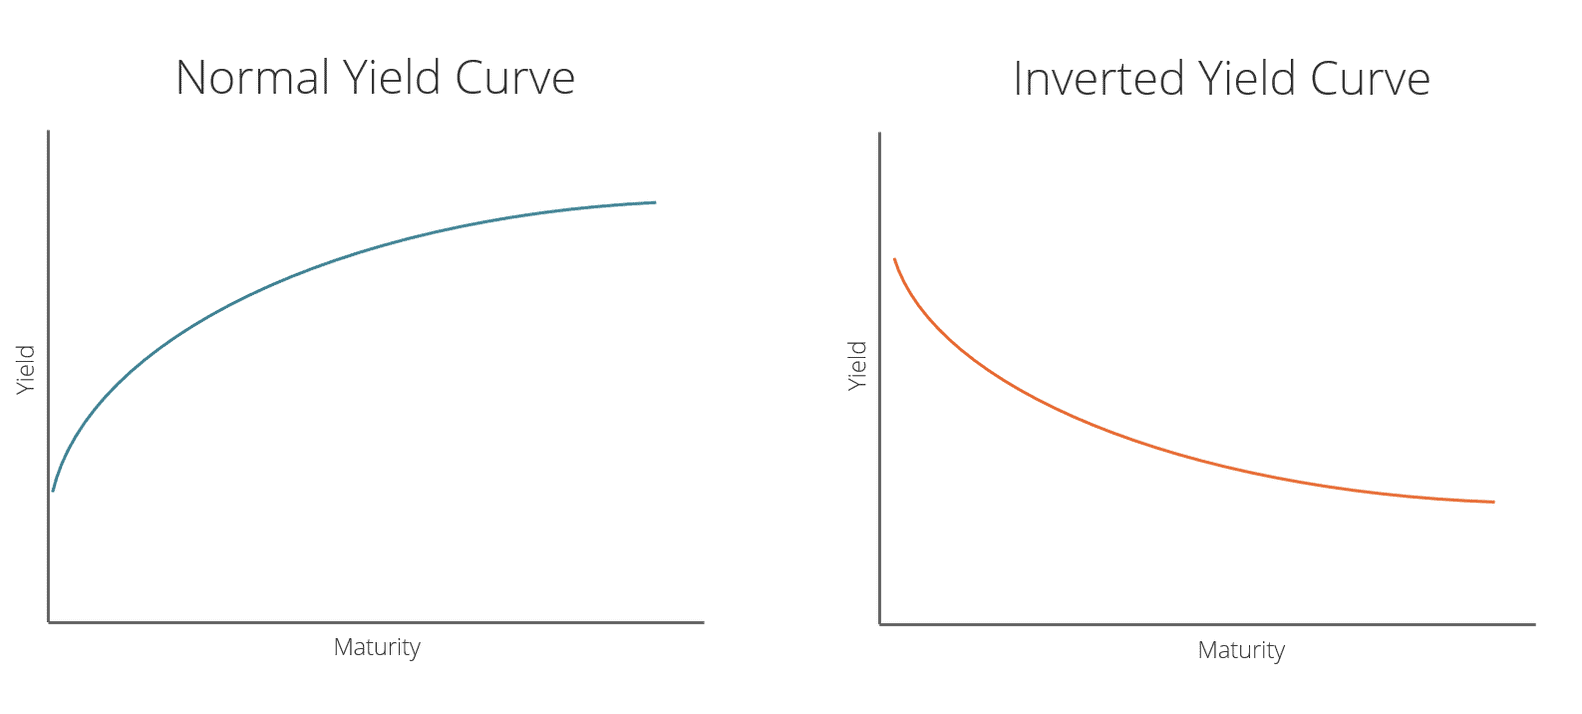
Source: https://corporatefinanceinstitute.com/resources/fixed-income/inverted-yield-curve/
This indicator was introduced in 1986 by Professor Campbell Harvey of Duke University, as he recognized a consistent pattern: every time the yield curve inverted, a recession tended to follow within 12 to 18 months.
Over the years, this pattern has been observed across several economic cycles, making the yield curve inversion a key tool for analysts, investors, and policymakers.
What Does Inversion Mean?
A yield curve inversion occurs when short-term bonds yield more than long-term bonds. This situation can happen for various reasons, including the following:
- Investor Sentiment: When investors are uncertain about the future, they often prefer the safety of long-term bonds. This increased demand pushes long-term yields down, which can contribute to an inversion.
- Inflation Expectations: If investors expect lower inflation in the future, they may be more willing to lock in long-term yields, driving those yields lower relative to short-term rates. On the other hand, if inflation is expected to rise in the near term, short-term rates might be adjusted upward by policymakers.
- Economic Outlook: A persistent inversion may signal that market participants expect economic growth to slow down, potentially leading to a recession.
An easy metric: 10-year vs 2-year spread
The most popular metric in the market is the spread between 10-year and 2-year U.S. Treasury yields, because it offers a clear snapshot of economic expectations.
The 2-year yield instantly reflects the Fed’s short-term interest rate moves, while the 10-year yield gives insight into long-term growth and inflation. When the 10-year yield drops below the 2-year, it signals caution.
This simple metric helps investors balance short-term policy impacts with long-term economic outlooks.
The blue line in the graph below represents this difference in yields. Anything below the black line signals inversion, and grey areas indicate recessions.
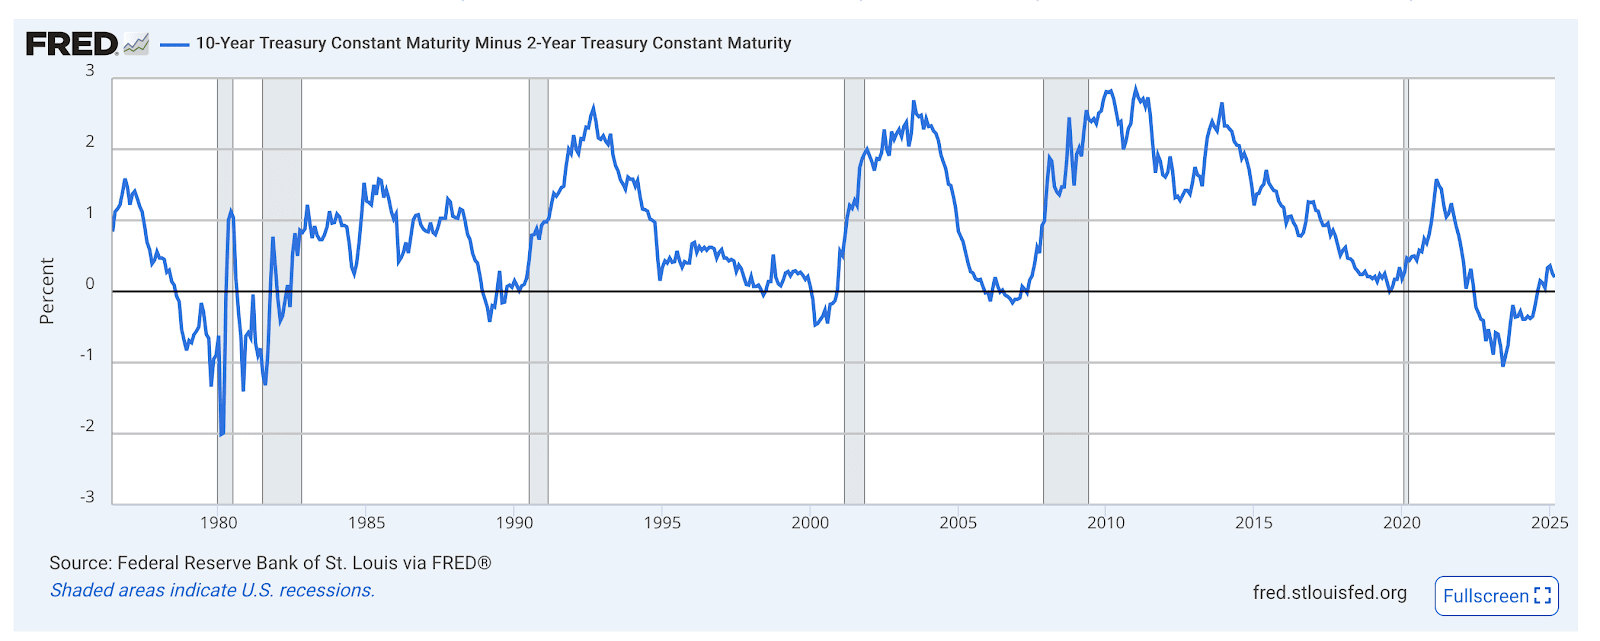
Source: https://fred.stlouisfed.org/series/T10Y2Y
Is the Yield Curve Still Relevant Today as an indicator?
While the yield curve has historically been a reliable recession predictor, the global economic landscape is constantly evolving. Factors such as global trade dynamics, technological innovations, and unconventional monetary policies (like quantitative easing) have added layers of complexity to financial markets.
Despite these changes, the fundamental economic psychology behind the yield curve remains intact. Investors still seek safer, long-term investments during times of uncertainty, making the yield curve a useful indicator of market sentiment.
Statistical Track Record
Historically, an inverted yield curve has preceded several recessions with impressive accuracy. For example, prior inversions in past decades have been linked to recessions in the early 2000s and the 2008 financial crisis. However, while its track record is impressive, no single indicator is foolproof. The yield curve should ideally be considered alongside other economic data.
The yield curve remains a relevant, accessible and easy to understand tool linked to market expectations, but it cannot be counted as the sole indicator of economic health. There are several other elements also playing crucial roles in predicting recessions such as: Unemployment Rate, Consumer Confidence, Stock Market Trends, Industrial Production and Manufacturing Data.
Should We Expect A Recession In The Next Two Years Based On Yield Curve Analysis?
Recent data indicates that the yield curve has inverted on several occasions over the past few months. This inversion has sparked discussions among market analysts, as similar patterns in previous cycles have often preceded recessions. While the yield curve is a useful signal, it’s only one piece of the puzzle.
Other indicators we should consider for further analysis include:
- Consumer Spending: There has been a slight slowdown in consumer spending, which raises cause for concern.
- Monetary Policy: Central banks appear to be maintaining a cautious approach, balancing between battling inflation and fostering growth. Just look at the behaviour of the FED, which is currently on standby.
- Global Economic Environment: International markets remain volatile, and geopolitical tensions, to put it lightly, are having a heavy influence on the world’s economic stability.
Considering these factors, some economists project that a mild recession could occur within the next two years. However, it is equally possible that proactive monetary policies and other mitigating factors might delay or even soften the impact of a recession. The yield curve inversion serves as an early warning system, suggesting that caution is warranted, but it should be weighed alongside other economic signals.
Conclusion
In today’s environment, the yield curve’s inversion is one of several signals that suggest caution. While it’s not an infallible predictor, its historical reliability cannot be ignored. It’s essential to take a balanced view—combining insights from the yield curve with other economic data—to better understand where the economy might be headed.
A key takeaway I would love for you to keep, is that while the yield curve inversion does raise red flags, it doesn’t provide a definitive timeline or guarantee a recession. Instead, it highlights potential vulnerabilities in the market, encouraging policymakers and investors to prepare for a range of scenarios.
Do I see a potential recession? I wish I could tell you. One thing is for sure, there are strong signals telling us to be more cautious than in previous years. Financial models need to prepare for the real possibility of something big coming in the future, as history tends to repeat itself. My personal motto: Hope for the best but prepare for the worst.
This communication is for information and education purposes only and should not be taken as investment advice, a personal recommendation, or an offer of, or solicitation to buy or sell, any financial instruments. This material has been prepared without taking into account any particular recipient’s investment objectives or financial situation, and has not been prepared in accordance with the legal and regulatory requirements to promote independent research. Any references to past or future performance of a financial instrument, index or a packaged investment product are not, and should not be taken as, a reliable indicator of future results. eToro makes no representation and assumes no liability as to the accuracy or completeness of the content of this publication.