


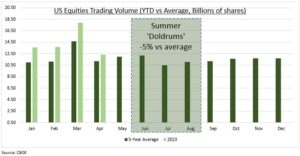
ANOMALY: S&P 500 and Europe’ Stoxx 600 seen a very low volume May so far. With Japan’s Nikkei 225 a notable exception. This has confounded market skeptics, as it has come alongside both low volatility and positive stock returns. Our seasonality analysis shows that volumes do not equate with performance. Markets are now in a justified wait-and-see mode after surviving Q1 results and the US banks scare. And ahead of the debt-ceiling showdown, potential Fed interest rate pivot, and sitting on unexpected double digit gains this year. US equity volumes are actually running well ahead of average (see chart) this year, thanks to options and retail markets. Whilst weaker summer volume seasonality is set to be modest if history is any guide.
VOLUME: We analyze the Cboe trading volume statistics for all US equity exchanges and the trade-reporting facilities (TRFs). This is important as the NYSE and NASDAQ now account for under 50% of total volumes. Equity trading volumes this year have actually been running well ahead of the five-year average between 2018-22. This is likely driven by the well-documented surge in short-dated options activity this year. This comes alongside the continued rise in importance of retail investors, and the huge and maturing high-frequency trading (HFT) industry.
SEASONALITY: Equity volume seasonality is less than is often assumed. Average June-August trading volumes are only 5% lower than the rest-of-year. July is typically the lowest volume month of the year. Volumes then are 28% lower than March, which is by far the heaviest volume month. The assumption is that low volume begets high volatility and poor performance. Average S&P 500 June returns since 1964 have been a positive 0.10%. This is well below average but better than the typically negative months of February and especially of September. Whilst the high volume month of March, at 1.00%, is above average but only the sixth best of the year.
All data, figures & charts are valid as of 22/05/2023