THREAT: High oil prices have been a double headwind for markets. With this year’s higher gasoline prices a $100 billion extra ‘tax’ on the US consumer, and threatening to boost inflation expectations. Demand has been resilient, supply tight, and inventories low. But higher oil prices are less scary today than in the past. OPEC is squeezing supply but overplaying its hand. Demand is sensitive to higher prices and ultimately self-correcting. The solution to high prices is high prices. $90 oil has not tipped the world into recession as in 1970’s. The inflation-adjusted oil price is the same as fifty years ago. We have seen the rise of alternatives (wind/solar) and substitutes (natgas). And a 60% fall in the energy intensity of our economies in recent decades.
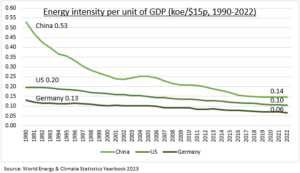
INTENSITY: The energy needed to produce a unit of GDP has fallen c.1.5% a year for decades, according to Enerdata. Driven by technological change, production efficiencies, and the shift to services. The improvement from the US, China, and Germany has been 63% the past thirty years (see chart). Europe has some of the world’s lowest energy intensity, 40% below the global average, and a key buffer to the recent energy crisis. The energy independent US sits at the global average, whilst manufacturing-heavy China is 30% above the average. The least energy efficient are the oil exporters plus Taiwan and Korea. Among the best are the UK, Italy, Spain.
NOT AS SEEMS: Higher energy has been driving inflation concerns in the US and elsewhere. But the impacts should not be overdone. Oil prices have become a lot less important to the economy and to markets. Manufacturing is only 12% of US GDP, for example. Gasoline 3% of the US inflation basket. The energy sector only 4% the S&P 500 index. Whilst current oil prices, adjusted for US inflation, are the same as 50 years ago at the time of the 1973 OPEC oil embargo price shock. This is in contrast to the spot price today which is three times as high.

All data, figures & charts are valid as of 05/10/2023.


