


BRACE: US inflation is the biggest number in markets. It’s driving the Fed rate cycle and macro and earnings recession risks. Plus the Fed ‘data dependent’ and markets looking for direction after the relief rally. Inflation uncertainty has risen after index’s annual statistical re-weighting, turn ups in gasoline and used car prices, and start-of-year price hikes. And only two of the past 12 monthly reports have been in-line with forecasts. This saw an average 1.9% S&P 500 and 1.3% Stoxx 600 ‘inflation day’ price swing. But our tracker (see chart) gives comfort that inflation is still on an underlying downtrend, and investors are already largely braced for some bad news.
REPORT: Consensus is looking for 7th headline inflation fall from 6.5% to 6.2%, but with a MoM pick up from 0.1% to 0.5%. Underlying core inflation is seen falling from 5.7% to 5.5%. The Fed NOWCast signals upside risk, with headline CPI at 6.48% and 0.65% respectively. It’s thirty-six days, and another monthly inflation report, before the next Fed meeting. But 2-year bond yields have risen 0.4% off recent lows, and Fed futures now repriced to two further 0.25% rate hikes.
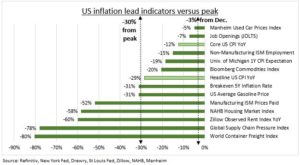
TRACKER: Reported US inflation is by definition a lagging indicator. Our tracker uses forward and coincident figures and shows easing pressures. These are down a median 30% from peak. And 3% from November, with 10 of 14 indicators down. We track six of the main segments: the labour market (employment ISM, JOLTS), housing (Zillow rent, NAHB index), goods (Used cars, Manufacturing ISM prices), commodities (Gasoline, broad commodities), supply chains (Fed’s supply chain index, container rates), and inflation expectations (Michigan survey, Break-evens). Supply chains, housing, and goods prices lead the fall, with the labour market lagging as usual.
All data, figures & charts are valid as of 13/02/2023