

Summary
Higher valuations drove the rally this year
This year has been the opposite of last, as higher valuations offset weaker earnings. This valuation re-rating will not last forever. Our ‘fair value’ P/E reality check is now flashing yellow, as bond yields started to rise again. This puts a ceiling on valuations. This is mainly a US problem, and we still see opportunities. There is ‘insurance’ in cheaper overseas markets and cheaper US sectors, from banks to telecoms.
Stock markets take a breathe
Stocks fell after their recent strong gains, sapped by Fed rhetoric and higher bond yields. Europe was supported by lower Nat gas and better Q4 earnings. EM hurt by Turkey’s earthquake and Brazil’s Central Bank standoff. AI wars heated up with GOOG’ flub, DIS latest to see cost cuts. M&A strong from NEM to CVS. Russia’ supply cut boosted oil. US inflation and BoJ decision coming highlights. See our 2023 Year Ahead HERE. See video updates, twitter @laidler_ben.
Method in the junk rally
The 2023 ‘everything’ rally led by big losers of last year, from crypto to disruptive tech. Typical of relief rally playbook as fundamentals turn less bad with investor sentiment low.
Share buybacks keep surprising
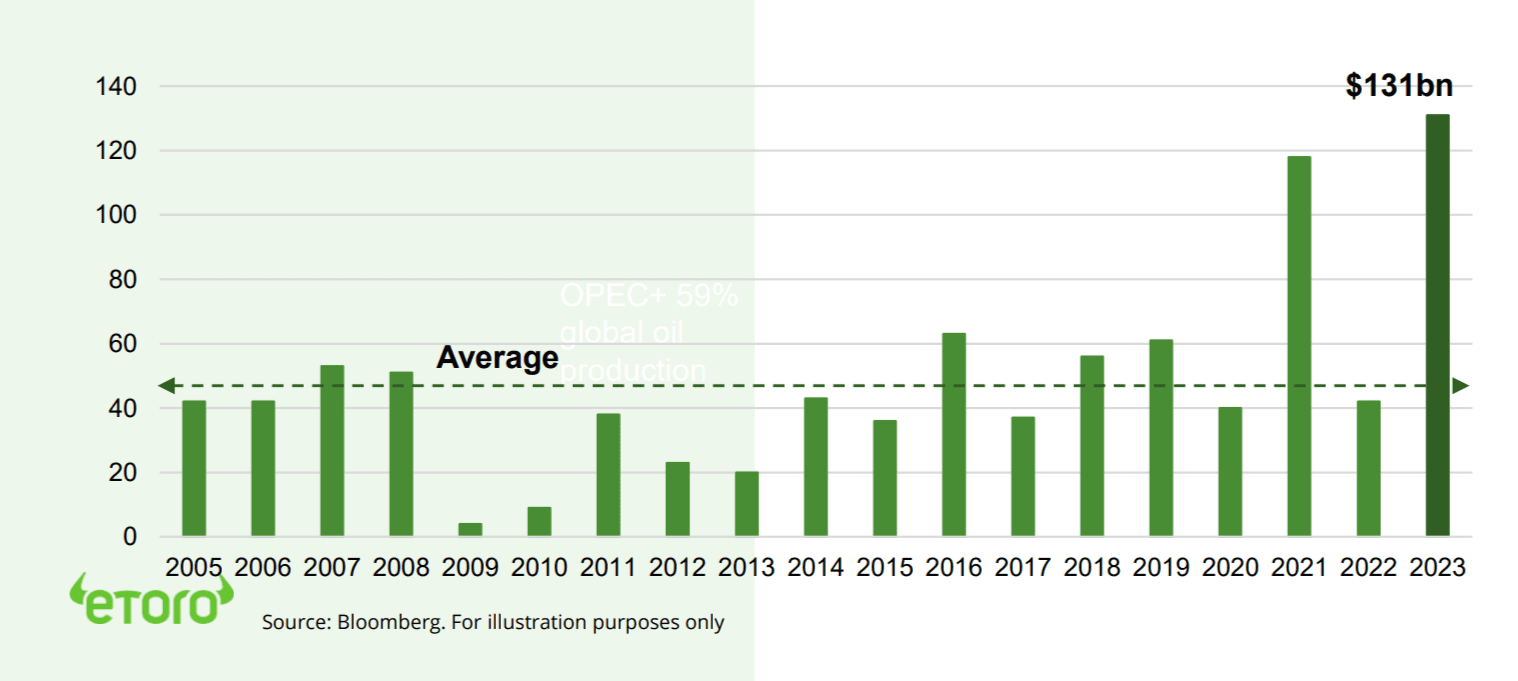
US share buyback announcements tripled vs Jan last year, to $131 billion. This is a welcome surprise and a key US equities support. Have been biggest buyer of US equities.
Valentines Day the next consumer test
Valentine’s Day the next test for the still-resilient US consumer. It’s a top-5 spending event of year, and consumption 70% the economy.
The costs of rising short-termism
Buffett says his favourite stock holding period is forever. But average holding time for US equities now 10 months vs 5 years in prior decades. This raises costs and hurts performance.
Crypto lower after its asset leading rally YTD
Crypto was not immune to the firmer dollar and bond yields and broader weakness in equities, but remains the best performing asset class this year. MATIC among those bucking the weakness on rising NFT use and new partnerships. US SEC have increased staking oversight, with Kraken closing its service and paying a fine.
Russia oil surprise helps commodities
Commodities higher as oil prices rebounded. Came even as the US dollar and bond yields rose. The asset class is -3% this year and the worst of all. Precious metals, silver and platinum, led prices down on macro headwinds. But was offset by higher oil prices after no.2 exporter Russia’s surprise 5% supply cut.
The week ahead: Inflation and consumer test
1) Hope for a 7th fall in US inflation to under 6.5% 2) UK to see a 3rd straight fall, but still over 10% as lags all. 3) US Q4 earnings home-stretch with KO, DE, ABNB, CSCO, PLTR, SEDG. 70% ‘beat’ so far. 4) Valentines and US retail sales spending test. 5) Naming of new BoJ governor.
Our key views: A clear but gradual recovery
Lower inflation sees near interest rate cycle top. Reopening China cuts recession risk. Peak bond yields support tech. Sticky inflation or higher for longer Fed mistake the risks. See a gradual recovery with plenty bumps in road. Focus cheap and defensive assets. Higher risk crypto, tech, small cap as inflation fall picks up.
Top Index Performance
| 1 Week | 1 Month | YTD | |
| DJ30 | -0.17% | -1.26% | 2.18% |
| SPX500 | -1.11% | 2.28% | 6.54% |
| NASDAQ | -2.41% | 5.77% | 11.96% |
| UK100 | -0.24% | 0.49% | 5.78% |
| GER30 | -1.09% | 1.47% | 9.94% |
| JPN225 | 0.59% | 5.94% | 6.04% |
| HKG50 | -2.17% | -2.52% | 7.12% |
*Data accurate as of 13/02/2023
Market Views
Stock markets take a breathe
- US stocks fell back after their recent strong gains, sapped by Fed rhetoric and higher bond yields. Europe outperformed on lower natgas and better Q4 earnings. EM was hurt by Turkey’s earthquake and Brazil’s Central Bank standoff. AI wars heated up with GOOG’ flub, DIS latest to see big cost cuts. M&A strong from NEM to CVS. Russia’ supply cut boosted oil. See our 2023 Year Ahead View HERE.
Method in the junk rally
- The 2023 ‘everything’ rally led by big losers of last year, from crypto to disruptive tech. It’s been dismissed as a low quality ‘junk’ rally or a ‘dash for trash’ and is seen as uninvestable. But is typical of the relief rally playbook as the fundamentals turn less-bad with investor sentiment depressed.
- There is some method in the perceived madness. Disruptive tech valuations, proxied by ARK Innovation largest holdings, have improved a lot. The median P/Sales is 5x vs 12x a year ago, and now in-line with NASDAQ. Half these stocks are forecast free cash flow (FCF) positive. And short interest ratios high. At 5.5x they are 50% higher than Dec. 2021 and double NASDAQ.
Share buybacks keep surprising
- US share buyback announcements have tripled versus January last year, to $131 billion. This is a welcome surprise and a key US equities support. Stock buybacks have historically been by far the biggest buyer of US equities. They are also unique to the US, with the rest of the world preferring dividends. The US buyback + dividend yield is 5%.
- Chevron (CVX) announced $75 billion buyback plan, equal to 20% its market cap. Meta (META) followed with $40 billion, equal to 10% its market cap. Come despite Dec. 31st start of new 1% buyback tax. And profits seeing their first falls since 2020.
Valentines Day the next consumer test
- Tuesday’s Valentine’s Day the next test for the still resilient US consumer. It’s a top-5 spending event of year, consumption near 70% the economy, and Q1 estimates or a robust 2.2% GDP growth. Surveys show romantics to spend 10% more than last year. Helped by low unemployment and excess savings still seen at $1.5 trillion, equal to 6.5% of GDP.
- Our ‘Valentines Index’ of related commodities gives good news. These prices lagged behind both the broader commodity rally and inflation. This is some rare good news for consumers. And a reminder not all commodities have participated in the energy-led rally of the past two years.
The costs of rising short-termism
- Warren Buffett famously says his favourite stock holding period is forever. The same cannot be said for other investors. The average holding period for US equities was 10 months last year, down from 5 years in prior decades. This is a global trend.
- This incurs extra transaction costs, taxes, and can leave you out of market, where it can be difficult to return. This became the pain trade for many during the January rebound. Interestingly, retail investors often have a built in advantage here, with longer time horizons and investment goals.
US share buyback announcements (January, US$ billions)
Crypto prices lower, after leading rally this year
- Crypto assets prices pulled back, after leading all asset classes up this year. Hurt by stronger US dollar, rising bond yields, and weaker equities.
- Polygon (MATIC) among those bucking the weakness. Saw ‘Whale’ buying amidst rising NFT usage and its new functional partnerships.
- Crypto equity correlations have fallen. This gives some protection. Whilst research shows Inflation is the only significant Bitcoin (BTC) macro driver.
- US regulation in spotlight, with Kraken exchange under investigation and Coinbase (COIN) raising concern on potential retail staking restrictions.
Russia oil surprise helps commodities
- Commodities had a better week, cutting the losses this year to -3%. But still worst of all major asset classes. Undermined by both a firming of the US dollar and the rise in bond yields. Precious metals prices bore the brunt of these macro headwinds, led down by silver and platinum.
- Brent oil prices rose back over $85/bbl. as no.2 exporter, Russia, unexpectedly announced a 5% production cut, equivalent to 0.5% of global oil supply. This came less than a week after the EU extended its price cap to Russian refined exports.
- Latest Q4 results from oil stocks BP (BP) and Shell (SHEL.L) were the latest to show both huge cash flow generation and increased dividends.
US Equity Sectors, Themes, Crypto assets
| 1 Week | 1 Month | YTD | |
| IT | -2.55% | 10.13% | 12.81% |
| Healthcare | -0.65% | -1.32% | -2.05% |
| C Cyclicals | -2.72% | 9.04% | 14.45% |
| Small Caps | -3.36% | 5.28% | 8.95% |
| Value | -0.42% | 0.39% | 2.36% |
| Bitcoin | -6.64% | 24.67% | 31.56% |
| Ethereum | -7.27% | 14.28% | 28.16% |
Source: Refinitiv, MSCI, FTSE Russell
The week ahead: US inflation and consumer test
- Tuesday’s US inflation report a latest test for the year-to-date stock relief rally. Est. for needed 7th fall, from December’s 6.5% and June 2022 9.2% peak. Risk of a MoM pick up from -0.1% to +0.5%.
- The UK also in inflation cross-hairs (Wed). Forecast -0.3% MoM price fall drives 3rd ease in price rises. But leaves inflation still over 10%. Week after the UK economy narrowly avoided recession, for now.
- US Q4 earnings home-stretch with KO, DE, ABNB, MAR and techs CSCO, PLTR, SEDG. 70% of S&P 500 stocks have beaten expectations, with EPS down 3% overall. Not great but is better than feared.
- Tue. Feb. 14th Valentine’s Day next consumer test, and before US retail sales. Est. +0.9% after weak Dec. At 70% of US GDP is key to economy. Also see official naming of Japan’s new BoJ governor.
Our key views: A clear but gradual recovery
- Consistently lower inflation gives visibility on the interest rate cycle top. Whilst the reopening of China cuts global recession risks. Restrained bond yields gave relief for the key tech sector. Sticky inflation or higher-for-longer Fed mistake the risks.
- We see a gradual market recovery with the low in, but plenty of bumps in the road. Focus cheap and defensive assets, from high dividend, to healthcare, and UK. With higher risk crypto, tech, and small cap as the inflation fall picks up and de-risks markets. Overseas markets to lead the US. Commodities and the dollar to take a performance back seat.
Fixed Income, Commodities, Currencies
| 1 Week | 1 Month | YTD | |
| Commod* | 1.50% | -2.60% | -3.66% |
| Brent Oil | 8.39% | 1.28% | 0.62% |
| Gold Spot | -0.07% | -2.42% | 2.53% |
| DXY USD | 0.64% | 1.34% | 0.05% |
| EUR/USD | -1.11% | -1.42% | -0.22% |
| US 10Yr Yld | 21.40% | 23.24% | -14.18% |
| VIX Vol. | 12.00% | 11.88% | -5.26% |
Source: Refinitiv. * Broad based Bloomberg commodity index
Focus of Week: the valuation health-check
Higher valuation drove this year’s rally. Expect more differentiation ahead.
Valuations have expanded this year after plunging last. Lower bond yields have driven this. This more than offsets lower earnings and has taken markets higher. But it has its limits, especially in the US. Bond yields have seen their lows. S&P 500 valuations are back to average. Whilst our ‘fair value’ P/E is flashing yellow. We focus on cheaper sectors and overseas markets, for the continued valuation re-rating upside and the implicit protection from disappointment. Big tech FAANGM’s offer better value than disruptive tech.
This has been a very different year, as higher valuations have offset weaker earnings
This year has been the opposite of last in more ways than one. Markets have seen a big rebound off lows. But the drivers have been very different. 2022 was all about an interest rate and bond yield driven collapse in valuations. This hit the most expensive segments, from crypto to tech, hardest. Whilst corporate profits stayed firm. This year is the opposite. Lower bond yields and interest rate expectations have allowed valuations to rise. This more than offset the falls in profit forecasts as the slowing economy catches up with the big interest rate hikes. But there are limits, especially in more expensive markets like US (and India).
Our ‘fair value’ P/E reality check is now flashing yellow. The valuation re-rating will not last forever
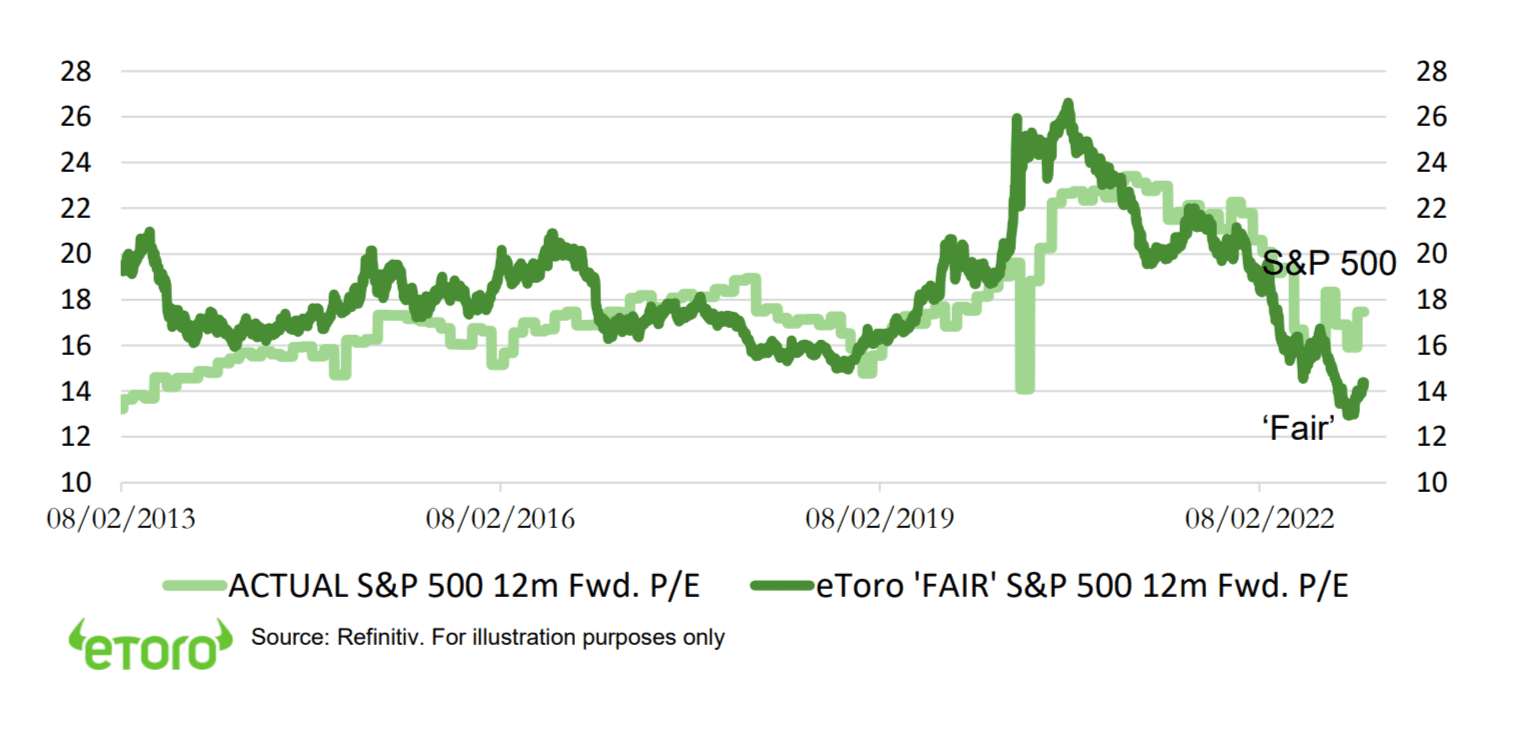
We use US 10-year bond yields, corporate profitability, and long-term GDP growth to estimate a ‘fair value’ S&P 500 P/E valuation. Its current 15x has been rising as yields have fallen recently. But there is a widening gap with the 18x of the actual index. This will put a ceiling on how high valuations can go. A 0.5% higher yield cuts our P/E by 10%. A return to the GDP outlook a decade ago (2.6% vs 1.9%) would raise it 20%.
Bond yields have a lot to answer for. If they have now bottomed, it puts a ceiling on valuations
Bond yields have a lot to answer for. Simply put, stocks are worth the present value of their future cash flows. And many investors use US 10-year bond yields to discount those future cash flows back to today. The higher bond yields go, the less those cash flows are worth, and the lower valuations are. This explains the dramatic falls last year of Growth stocks, and outperformance of cheaper Value segments.
This is mainly a US problem. There is ‘insurance’ available overseas and in cheaper sectors
These pressures are lower outside the US, where valuations are lower, and often well-under averages. Even after a 50% rally, Chinese equities are on 10x P/E and Italy’s on 8x even near a new index all-time high. They are also very different between US sectors, with telecoms, banks, energy all 10x P/E versus tech and consumer discretionary over 20x. The equal weighted S&P 500 is at an 8% discount to the headlines.
S&P 500 forward P/E vs ‘Fair Value’ P/E
Key Views
| The eToro Market Strategy View | |
| Global Overview | Aggressive Fed interest rate hiking cycle and stubborn inflation boosted uncertainty, recession risk, and hit markets. We see this gradually fading in 2023, with global growth stressed but resilient, inflation pressure slowly easing, and valuations now more attractive. Focus on cheap and defensive assets for a gradual ‘U-shaped’ market recovery. |
| Traffic lights* | Equity Market Outlook |
| United States | World’s largest equity market (60% of total) seeing slowing but resilient GDP and earnings growth. Valuations led the market rout, and now below average levels, and are supported high company profitability and near peaked bond yields. Fast Fed hiking cycle boosted recession risks. Focus on cash-flows defensives, like healthcare and high dividend. Big-tech supported by defensive growth. See gradual ‘U-shaped’ rebound as inflation slowly falls and de-risks market. |
| Europe & UK | Favour defensive and cheap UK equities (‘Economies are not stock-markets’) over high risk/high return continental Europe. Recession risks high with Russia and energy crisis, threatening to overwhelm ‘buffers’ of rising fiscal spending (defence and refugees), low interest rates (slow to raise ECB), and weak Euro (50%+ sales from overseas). Equities partly cushioned by lack of tech, and 25% cheaper valuations vs US. Favour cheap and defensive UK over Continent. |
| Emerging Markets (EM) | China, Korea, Taiwan dominate EM (60% wt.), and more tech-centric than US. Positive on China as economy reopens, cuts interest rates, and eases tech regulation crackdown. Valuations 40% cheaper than US and market out of favour. Recovery helps global sectors from luxury to materials. Broader EM needs weaker USD and peak US rates catalyst. |
| Other International (JP, AUS, CN) | Canada and Australia benefit from strong equity market weight in commodities and financials, if global growth resilient and bond yields risen. Japanese equities among cheapest of any major market, benefit from weaker JPY and with low inflation, offsetting structural headwinds of low GDP growth, an ageing population, and world’s highest debt. |
| Traffic lights* | Equity Sector & Themes Outlook |
| Tech | ‘Tech’ sectors of IT, communications, consumer discretionary (Amazon, Tesla), dominate US and China. Hurt by higher bond yields and above average valuations. But structural stories with good growth, high margins, fortress balance sheets support some. ‘Big-tech’ attractive new recession defensives. ‘Disruptive’ tech is much more vulnerable. |
| Defensives | Core positions as macro risks rise and bond yields are better priced. Consumer staples, utilities, real estate attractive defensive cash flows, less exposed to rising economic growth risks, and robust dividends. Offset impact of higher bond yields. Healthcare most attractive, with cheaper valuations, more growth, some rising cost protection. |
| Cyclicals | Higher risk cyclical sectors, like discretionary (autos, apparel, restaurants), industrials, energy, and materials, are cheap and attractive if see a ‘slowdown not recession’ scenario. Are select but high risk opportunities from energy to financials stocks. With often depressed earnings, cheaper valuations, and have been out-of-favour for many years. |
| Financials | Benefits from high bond yields, charging more for loans than pay for deposits. Also one of cheapest P/E valuations, and with room for large dividend and buyback yields. But can be outweighed by high recession risks, with lower loan demand and higher defaults. Banks most exposed. Insurance and Diversifieds (like Berkshire Hathaway) the least. |
| Themes | We favour Value over Growth on GDP resilience, lower valuations, rising bond yields, under-ownership after decade under-performance. Dividends and buybacks recovering with cash flows. Power of dividends under-estimated, at up to 1/2 of total long term return. Secular growth of Renewables and Disruptive Tech investment themes. |
| Traffic lights* | Other Assets |
| Currencies | USD ‘wrecking ball’ driven by rising Fed interest rates and ‘safer-haven’ bid. Many DM currencies hurt by still low interest rates and struggling growth. ‘Reverse FX war’ interventions ineffective. Strong USD hurt EM, commodities, US foreign earners like tech. But helps big EU and Japan exporters. Stabler USD outlook as near top of Fed cycle. |
| Fixed Income | US 10-year bond yields risen above prior 3.5% peak, as Fed hikes continue aggressively and balance sheet runoff accelerates. Set to ease as recession risks rise and inflation expectations fall. Additionally US has a wide spread to other market bond yields, and structural headwinds of all-time high debt, poor demographics, low productivity. |
| Commodities | Strong USD and rising recession fears hit commodities. But still above average prices helped by GDP growth, ‘green’ industry demand, supply under-investment, recovering China, Russia supply crisis. Oil helped by slow return of OPEC+ supply and Russia 10% world oil supply problems. But commodities not to repeat their 2022 performance leadership. |
| Crypto | In the latest ‘crypto winter’ (16th crash for bitcoin) with dramatic and early asset class sell-off and later specific risk events from Luna to FTX. See long term asset class development with small size under $1 trillion, correlations low, regulation growing, development/catalysts continuing – Ethereum merge to proof-of-stake and coming BTC halving. |
| *Methodology: | Our guide to where we see better risk-adjusted outlook. Not investment advice. |
| Positive | Overall positive view, and expected to outperform the asset class on a 12-month view. |
| Neutral | Overall neutral view, with elements of strength and weakness on a 12-month view |
| Cautious | Overall cautious view, and expected to underperform the asset class on a 12-month view |
Source: eToro
Analyst Team
| Global Analyst Team | |
| CIO | Gil Shapira |
| Global Markets Strategist | Ben Laidler |
| United States | Callie Cox |
| United Kingdom | Adam Vettese Mark Crouch Simon Peters |
| France | Antoine Fraysse Soulier David Derhy |
| Holland | Jean-Paul van Oudheusden |
| Italy | Gabriel Dabach |
| Iberia/LatAm | Javier Molina |
| Nordics |
Jakob Westh Christensen |
| Poland | Pawel Majtkowski |
| Romania | Bogdan Maioreanu |
| Asia | Nemo Qin Marco Ma |
| Australia | Josh Gilbert |
Research Resources
Research Library
eToro Plus: In-Depth Analysis. Dive deeper into market insights: Read daily, weekly and quarterly summaries, catch up on the latest market trends and get the most recent, in-depth overview of markets.
Presentation
Find our twice monthly global markets presentation on the multi-asset investment outlook.
Webinars
Join our live Weekly Outlook webinars every Monday at 1pm GMT, or watch the replay at your convenience. Also see the other online courses and webinars.
Videos
Subscribe to our timely video updates on market moving events, and the ‘week ahead’ view
Follow us on twitter at @laidler_ben
COMPLIANCE DISCLAIMER
This communication is for information and education purposes only and should not be taken as investment advice, a personal recommendation, or an offer of, or solicitation to buy or sell, any financial instruments. This material has been prepared without taking into account any particular recipient’s investment objectives or financial situation and has not been prepared in accordance with the legal and regulatory requirements to promote independent research. Any references to past or future performance of a financial instrument, index or a packaged investment product are not, and should not be taken as, a reliable indicator of future results. eToro makes no representation and assumes no liability as to the accuracy or completeness of the content of this publication.