INFLATION: US inflation is the most important number in markets. Easing core inflation opens the way to Fed interest rate cuts and supports the economic and earnings outlook. Sticky prices would mean a longer Fed cycle, more recession risk, and challenge the fragile market optimism. We are in an inflation no-man’s land now. With mixed messages of rising headline inflation but easing underlying pressure. This may take a few frustrating months to resolve, with the final fall toward Fed’s 2% target the hardest. But easing housing and jobs market pressures are key and encouraging. August’s consensus is for a gas-driven second month of higher headline inflation, to 3.6%, vs a new core inflation low, at 4.3%. The Cleveland Fed NOWCast shows upside risk.
TRENDS: Our tracker of leading and coincident data supports the better inflation outlook. With large falls in key housing and labour pressures, which dominate the inflation basket and ‘sticky’ services-led prices. This offsets warnings from forward-looking PMIs and commodities. Long-term market inflation expectations are well-anchored, at 2.3%, even as consumer forecasts drift up. The tracker is flat month-over-month, with 6 of 13 indicators up, and 37% below peak. We track labour (employment ISM, JOLTS), housing (Zillow rent, NAHB index), goods (Used cars, Manufacturing ISM prices), commodities (Gasoline, broad commodities), supply chains (GSCP index, container rates), and expectations (Michigan survey, Break-evens).
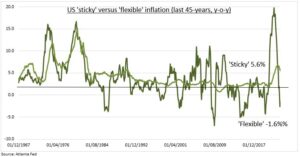
STICKY: The Atlanta Fed divides inflation in two. Goods-heavy ‘flexible’ prices, from fuel to cars and clothing, at around 30% of inflation. These have collapsed as supply chains normalized and a pandemic goods demand hangover set in. They are now finding a tentative floor. The other 70% are services-heavy ‘sticky’ prices, like rent, utilities, education, and medical care. These sticky prices, alongside wage growth (also from Atlanta Fed), have peaked and are now inching lower as housing and labour markets soften under lagged impact of 5.25% interest rates.

All data, figures & charts are valid as of 12/09/2023.


