COMMODITIES: Silver has led the precious metals rally, up 33% in a year, and been one of the few stand outs in a miserable year for broad commodities. Precious metals have been boosted by lower US bond yields, easing competition for these non-yielding assets. And by a weaker US dollar, making commodities cheaper for overseas buyers. Silver has been especially helped by the improving tech-led demand outlook, from solar to batteries. Alongside less mine output from 50% producer LatAm, the market is set up for a widening deficit. Silver is now a lesser-known and ‘cheap’ tech rally proxy. See Wheaton (WPM), Pan American (PAAS), Fresnillo (FRES.L).
DEMAND: Half of all silver demand is for industrial uses, a quarter for jewelry and silverware, and only a quarter for investment purposes. This real world versus investment demand split is near the opposite of ‘safer-haven’ gold. Silver’s industrial demand outlook has been boosted by the more gradual-than-feared global economic slowdown, the now-turning tech cycle, and structurally rising renewables spending. Solar, electronics, and batteries have risen to 25% of all silver demand, and more than replaced the collapse of photography needs in recent years.
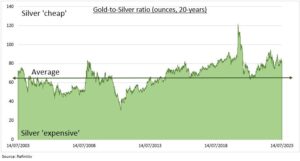
RATIO: The gold/silver ratio, sometimes also known as the ‘Mint Ratio’, measures how many ounces of silver are needed to purchase one of gold. The two prices are strongly related with a correlation around 0.8 the past two decades. Whilst silver is historically around twice as volatile, reflecting its smaller market size and more volatile end uses. It currently needs 78 ounces of silver to buy one of gold. This is around 15% above the twenty-year average level (see chart). The higher the ratio the ‘cheaper’ silver is relative to gold. Both prices freely trade today but their relationship has been fixed in the past, at 12:1 during Roman Empire, and 16:1 in the US 1800s.

All data, figures & charts are valid as of 17/07/2023.


