

I’ve been investing for a large part of my life, and I’ve never seen negative sentiment like this before. Not even during the most recent two bear markets. First for the Covid-19 crash and later when the Fed went through a nasty interest rate hiking cycle to deal with inflation, which was in my opinion, self-inflicted. It should be noted that ”officially” both crashes didn’t come with a recession, however, we do know that post Covid the economy shrank for the required two consecutive quarters, but there was debate over its classification as the jobs market was robust. This is a little grey though, since this was government backed, just like real personal disposable income that declined in 2022 and was offset by stimulus. So, in my mind, the government shot itself in the foot to avoid a technical recession, which created a bigger problem later down the line that we are still dealing with today. Has a soft landing been achieved? Or are we coming in hot?
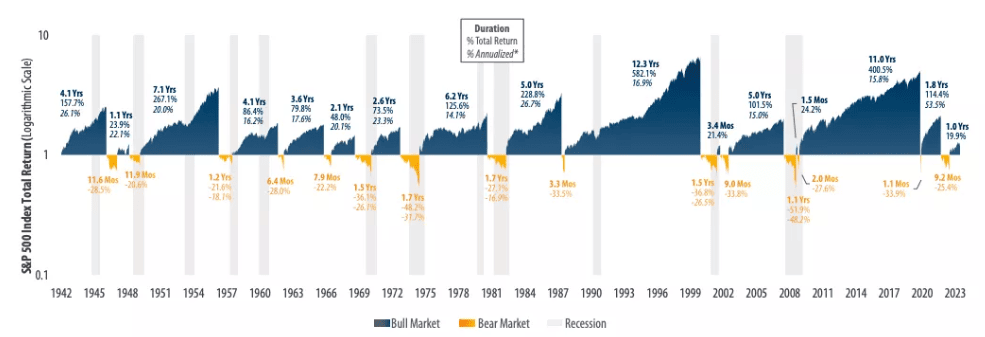
Bear markets through history – 56% coincided with recession
Source: Investopedia
Looking at this recent correction, the S&P 500 dropped just over 10% in 16 trading days. On average, corrections of this size since 1950 have taken approximately 39 days. I think the speed of this drop is likely what is causing more panic to build. Other crashes that occurred at this velocity post-2000 include the 2008 financial crisis, debt ceiling crisis, Fed hike cycle, and COVID-19 crash. All these events were a strong and immediate risk to the economy.
What’s causing the drop today? Tariff threats mainly, at least that’s what the media is pushing. We have known for some time that this was Trump’s agenda, which begs the question why this is shocking the market so much since they are forward looking. We saw the reverse happen when he won the election and the markets pumped, excited by the idea that less red tape and favourable economic policies were coming.
The reality is there are some fundamental concerns, but the current market movement seems disproportionate to the underlying factors, and may not fully reflect the long-term outlook.
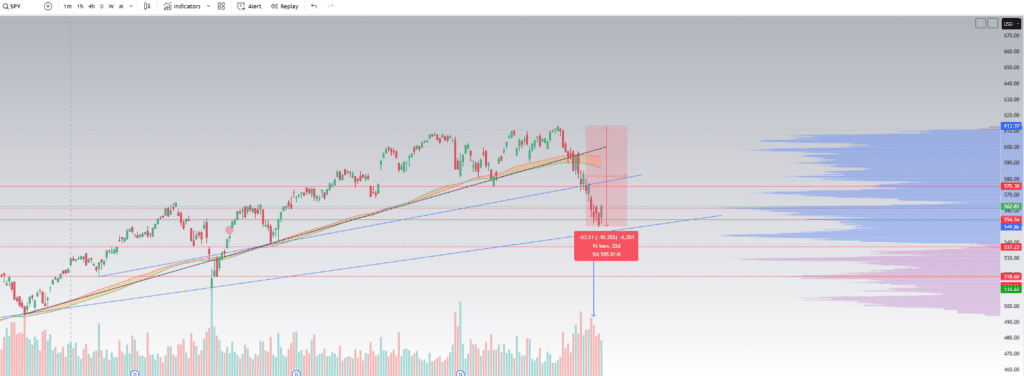
Current drop in the SPY
Source: Trading View chart
Whilst a -10% drop doesn’t seem like much; the result can be much more meaningful to stocks within the S&P 500. Signalling some great buying opportunities on some ”stable” stocks.
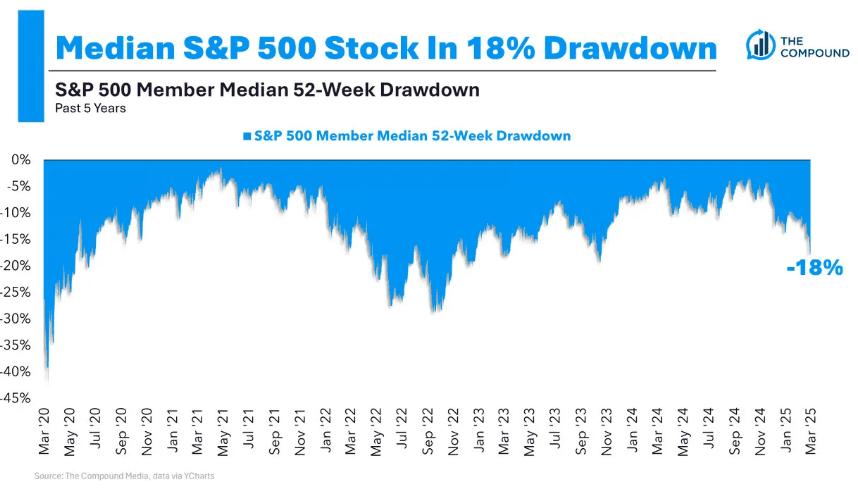
Source: YCharts
Sentiment
Recent data has highlighted some interesting points. In the chart below we can see Michigan University’s change in business conditions in a year is now the most bearish it’s been in history. Let that sink in. The market is more fearful than Covid, interest rates and inflation going up. The sentiment currently reflects a level of negativity that is unprecedented in recent history, even surpassing the challenges seen during the financial crisis and other major market events.
Of course, take this with a pinch of salt. These types of surveys aren’t my favourite, and I don’t like the groups or the way the data is collected, but it certainly lines up with a lot of what we are seeing and hearing out there.
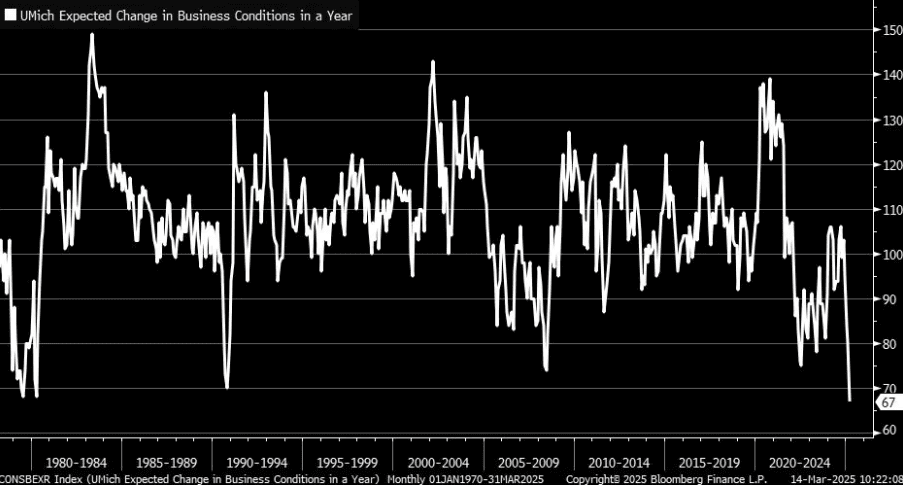
Source: University of Michigan
This is typically a left leaning base but even the right side shows a negative outlook, easier to identify when we look at their breakdown of consumer expectations between parties in the chart below. Democrats are certainly a little more… negative.
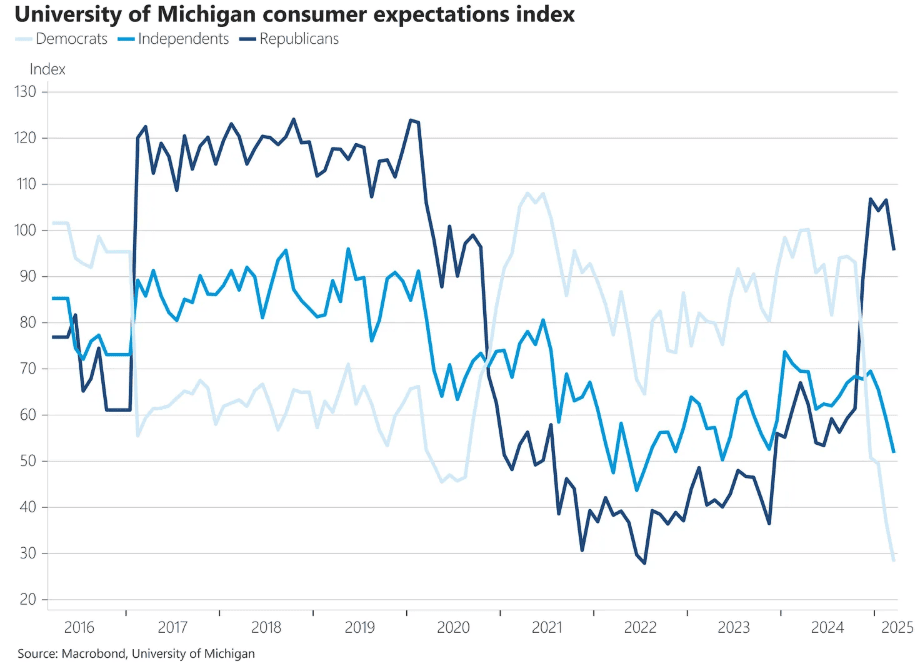
Source: University of Michigan
Another chart that appears alarming at first glance is the Expected change in financial situation in a year, but ironically this level of fear (Below 100) during previous economic downturns has typically been indicative of the market being close to its bottom. We can overlay that data onto the SPY and find that in 1979, 1980, 2008, and 2022, the markets were close to peak fear and moved higher soon after.
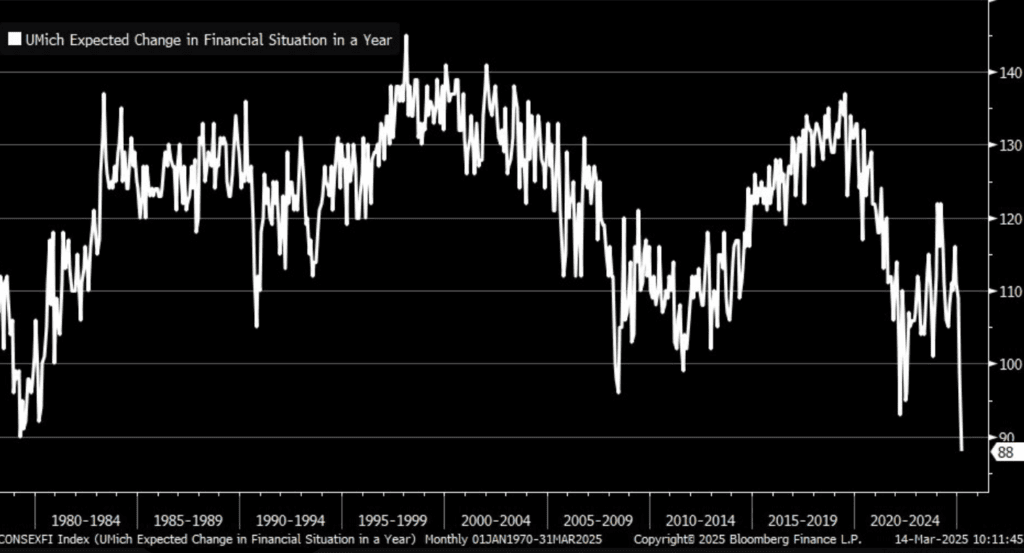
Source: University of Michigan
Other market sentiment gauges include the AAII bull-bear spreads, which has fallen off a cliff. Previously when this level was hit in 2022, the market recovered a few weeks after. I find this one the most useful when measuring perceived sentiment. For me, it’s a good indicator of when is a good time to lean into the fear, provided that the underlying fundamentals are still on track of course. Scaling into positions when this metric drops below 20 and scaling out of positions when it’s over 20 is risk management that makes sense to me.
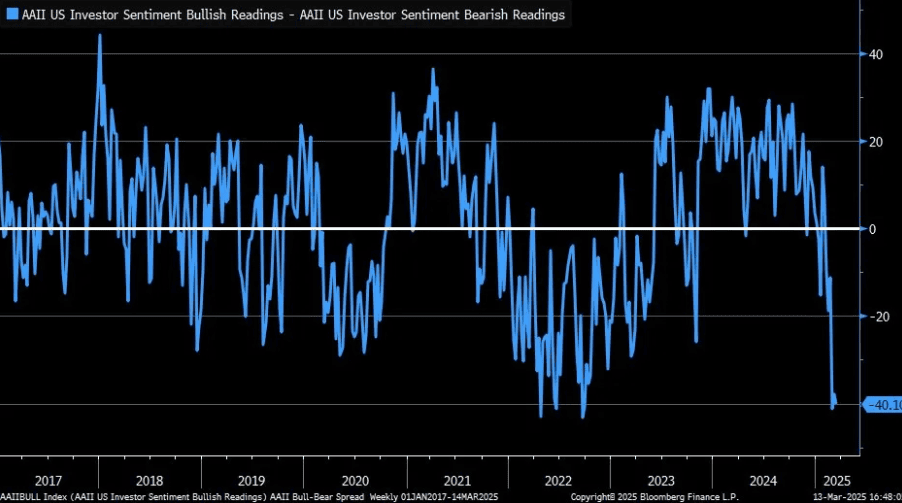
Source: Bloomberg
If you would prefer a more simplistic metric to follow, the fear and greed index offers a less accurate model. A lot of people like to quote Buffet ”Be fearful when others are greedy and greedy when others are fearful.” when referring to this one and It’s going to give you very broad strokes but it’s not a bad place to start.
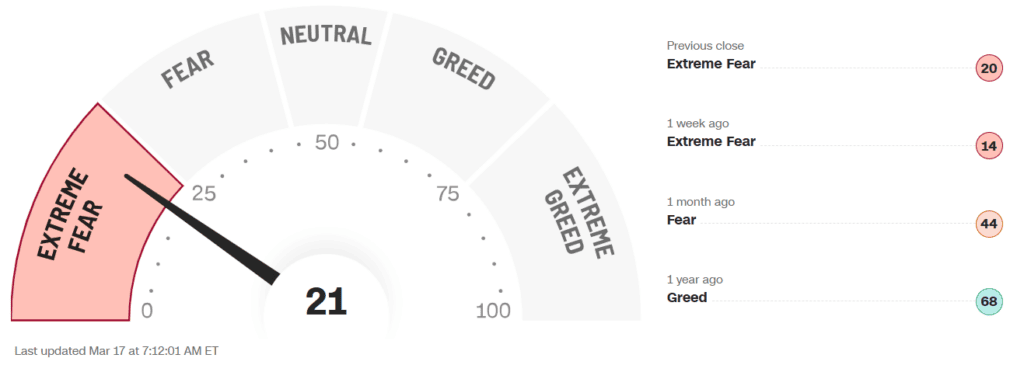
Source: CNN
We also recently got the New York Fed survey data and you can find that by clicking here. To save you from more charts I’ll stick with giving you the cliff notes version of the data. The results show a clear acceleration in perceived risk of higher unemployment across most regions and demographics, with participants also more negative about future household finances. Putting levels for each of these measurements back at late 2022 levels.
The data presented aligns with established market cycles and offers insights into investor psychology, which can be a significant influence on market behavior. Sentiment is often more important than the underlying data and how investors perceive that data can move the market its ways. Headline data creates sharp initial reactions, but sensible heads take time to sort through the noise to make a decision. The market in general will catch up to its mistake at some point when news is digested and sentiment changes. This applies to the broad market indexes and specific companies.
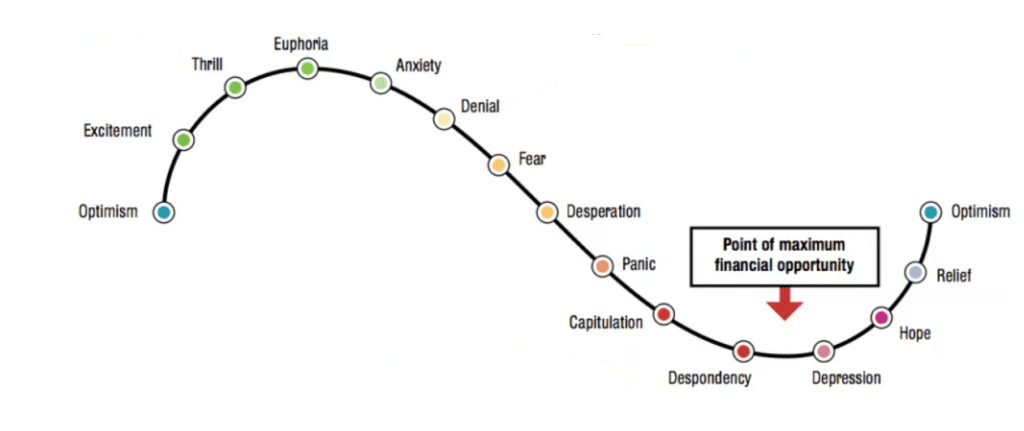
Source: Understanding economic, market and super cycles | FundCalibre
You can find charts and data points like this everywhere with very little effort and the reason I’m showing you all this data is simply to show you that perceived risk is off the charts. Based solely on these charts, one might conclude that there are significant risks ahead. However, it’s essential to consider a wider range of economic indicators before drawing conclusions.
What triggered the bad sentiment?
The new big bad worry we must deal with is recession. Economists have been yapping about it for an age, and they couldn’t have been more wrong over the past few years. Could this be somewhat impacted by their reluctance to call the post Covid economic contraction a recession? Maybe.
Concerns over weak GDP have been partly driven by the Atlanta Fed’s GDP updates, which are used by the Federal Reserve. While this data raises concerns, it should be considered alongside other economic indicators for a clearer picture. It primarily attributes the drop to the trade balance deficit and if you dig into the data the imports are skewing those numbers. If we think for a second why that is, it doesn’t make much sense to base an opinion on that data.
The -2.6% GDP figure raises questions about its accuracy and the factors contributing to this drop. Further analysis is needed to understand its implications fully.
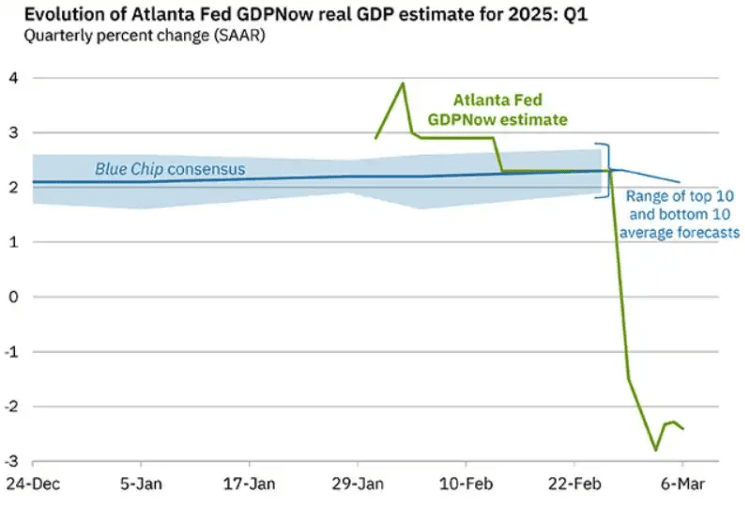
Source: Atlanta Fed
Concerns over tariffs are affecting companies in certain sectors, prompting them to adjust their strategies to maintain margins amid uncertainty. Affected companies send goods in bulk before tariffs are imposed. We saw this being a huge issue during Covid, exacerbated by shipping constraints. It got so bad in Covid that inventory levels got a little spicy, which caused further issues when demand slowed down. Huge shipments of Gold moving back to the US is a large part of this too, it’s not just consumer goods causing the numbers to be so off-kilter.
Net exports from the final February print are way out of character. Showing huge imports offsetting exports.
Important note: There is clearly a decline in activity since the end of February 2025, specifically relating to the consumer, but not as alarming as the initial chart indicates and improving after a drop.
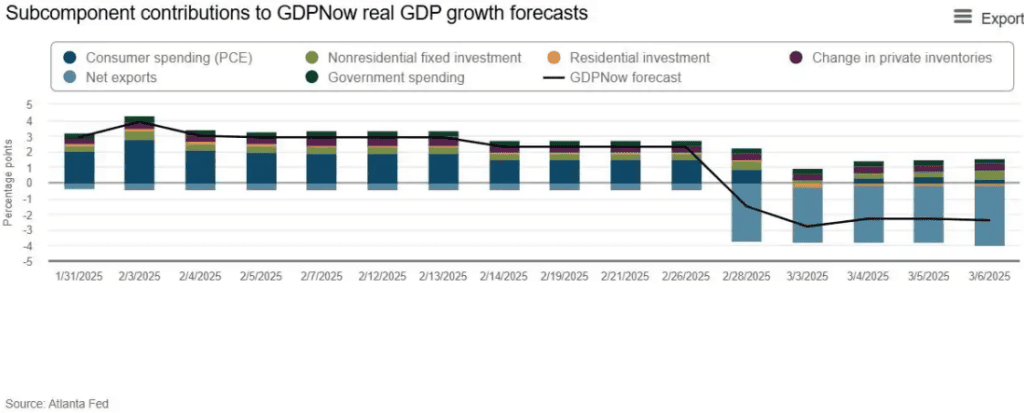
Source: Atlanta Fed
Why is the bottom close, or at least a bounce?
The Equity Put/Call ratio is back in favourable balance.
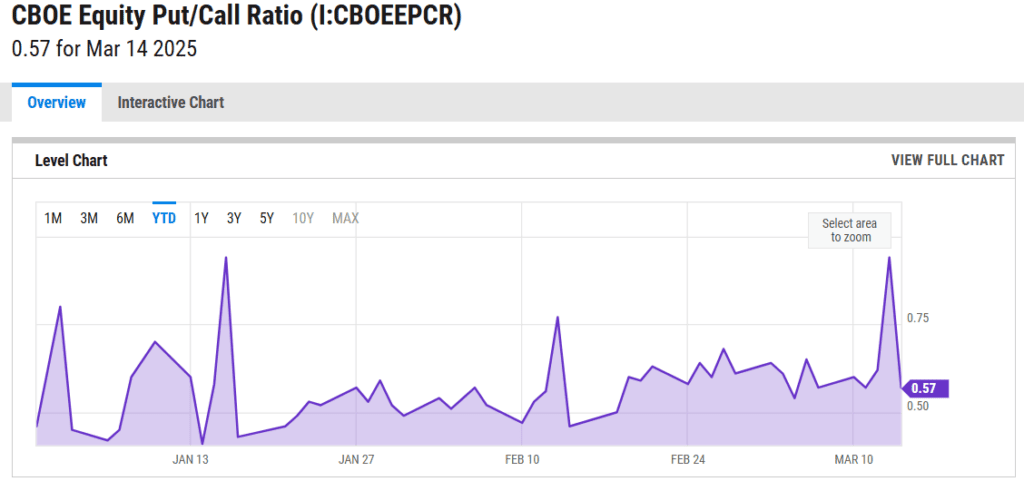
Source: CBOE Equity Put/Call Ratio Market Daily Insights: CBOE Daily Market Statistics | YCharts
The VIX has cooled off. I’d be happier to see it settle under 20 the decline here is positive to see. If this bad boy starts rising… We’ll be getting more downside.
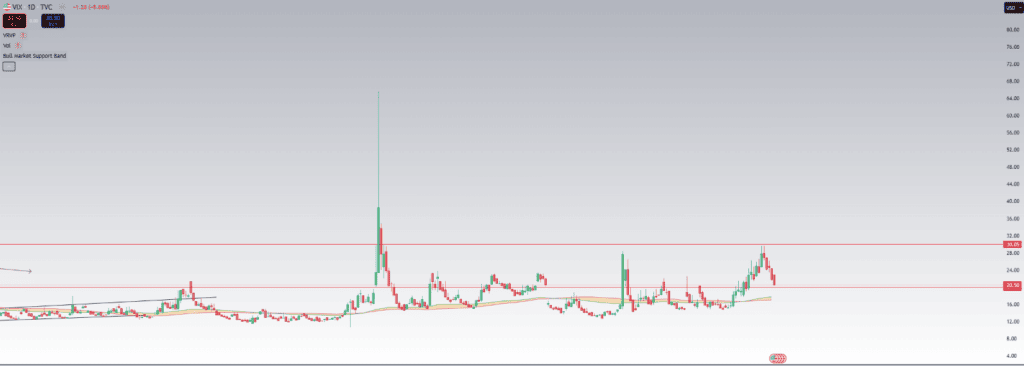
Source: My TA
Hedge funds have been unwinding positions in single stocks at the fastest rate we have seen in over 2 years, reducing their market exposure, but still maintaining a positive outlook. Suggesting they are just rolling with the short-term noise, which is fairly standard behaviour for hedge funds. So why am I mentioning this as a positive indicator? The good news is they’ll have plenty of cash to deploy when they sit fit. It’s this style of risk on investing that drives the V shaped recoveries that we often see after a correction.
Volume is also falling for the SPY, suggesting some seller exhaustion and the RSI has been at levels typically only hit when there’s a strong bounce or reversal.
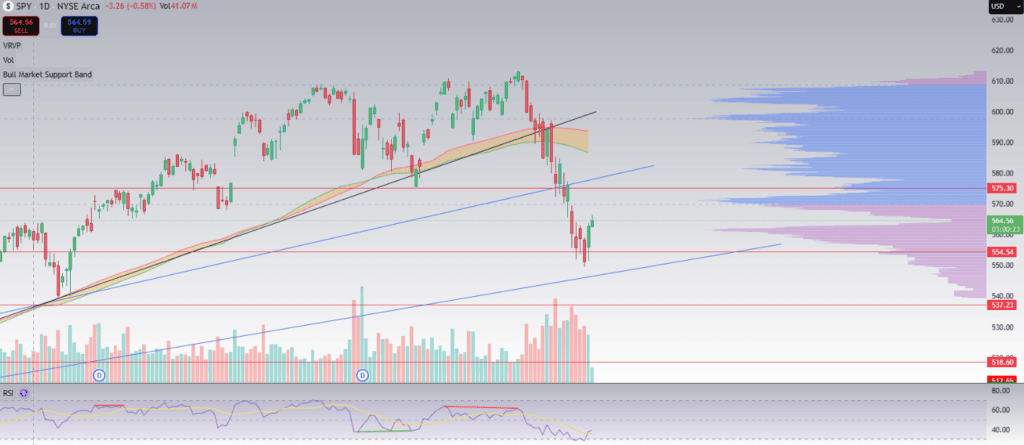
Source: My TA
I did want to briefly touch on some general market trends. I’m sure you’ve seen loads of charts like this lately, but they stand true. If we look at prior fastest 10% drops in the market, on average 3 months from the drop we have a return of 8.2%, 6 months is a 15% return, and one full year is a tidy 19.9% return. This happens regardless of a recession or more downside price action.
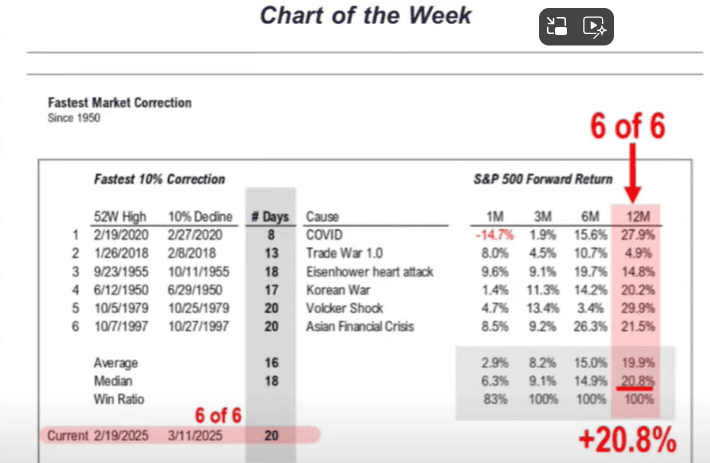
One thing we do know for sure, is these drops provide excellent long-term potential for buyers that can handle the volatility.
Why I’m buying the dip
Most people are only looking at this drop with a very short-term view. Does that make sense? No. Treasury Secretary Scott Bessent has been very clear on allowing markets to endure some short-term pain for long term gain. From a Macro perspective, there’s great benefits in allowing things to decline over the short term and my expectation is that this is being done for several reasons. First, to nudge the Fed into cutting more aggressively and allowing the US debt to be refinanced at lower rates. Second, Bessent has also been very clear on his desire to sort out the 10yr and get that rate lower. A high yield puts pressure on the housing sector, which is a troubled sector right now. Something not many people mention is that when the yield is low, it can boost stock prices because the present value of future earnings is higher. A higher yield can lead to lower stock valuations as the cost of capital increases, making equities less attractive compared to the risk-free return on government bonds.
Just to be clear, I don’t see inflationary risks to the market. The Fed’s data is somewhat lagging (Approx. 45 days behind the Truflation data) so I wouldn’t get hopes up for an immediate cut.
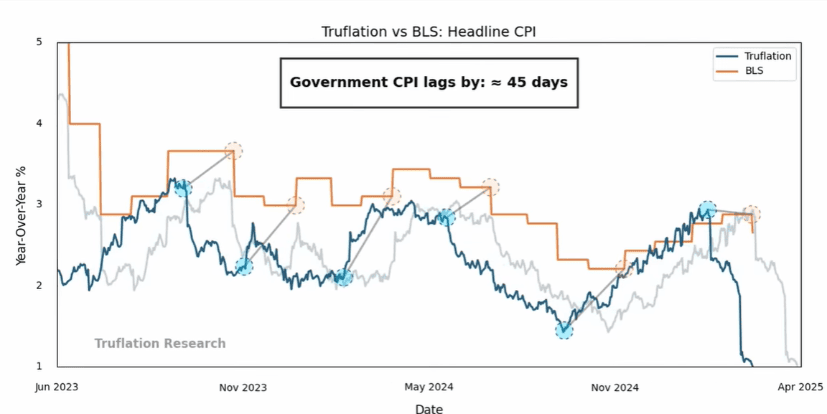
Source: Truflation US Inflation Index | Truflation
Risks
Short term: A hawkish Fed this week that continues with QT could push us lower and Trumps tariff update on April 2nd could stoke up fear.
Long term: The ”mortgage crisis” and locked up real estate sector needs to be addressed, and US debt needs to be managed, which is what Bessent is set on dealing with.
Quantitative tightening is seen liquidity leave the system and it’s looking worrying to me right now. Probably the measure I’m most concerned with. The M2 measure has got people excited but liquidity is more complex than that. US money markets should be sounding some alarm bells to the Fed and it’s really the heart of the economy. The SOFR (Repo rate) less Fed funds spread has been spiking since July 2024, price should be stable within the tram lines as they indicate the normal range. What does this mean? Essentially there won’t be enough liquidity to sustain institutions that depend on it, such as banks, which are seeing falling reserves. Bank reserves peaked at $4.2 trillion but have since lost over a trillion dollars, falling to $3.25 trillion. It’s suggested that a drop below $3.2 trillion, which is only $50 billion below current levels, could trigger a black swan event.
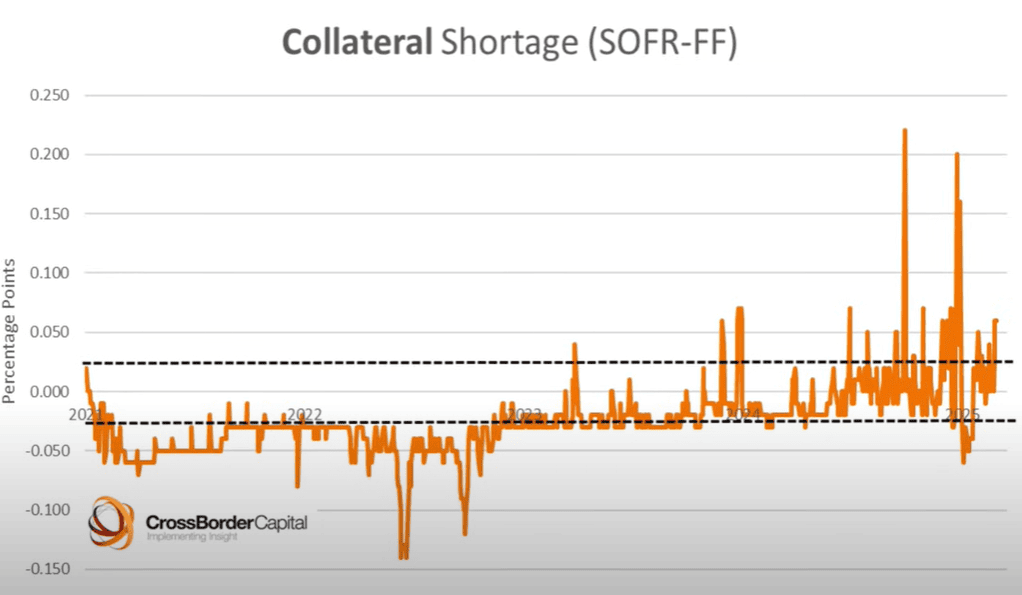
Source: CrossBorderCapital
There are other factors that have exacerbated this though, such as reverse repo’s running dry and all those short term issuances Janet Yellen left as a little gift for Bessent falling off too (It’s likely this was an attempt to boost Biden’s re-election chances), but that’s getting into complex territory and a discussion about hidden QE/QT. Silver lining though, QE starting should alleviate this pressure and if they set the balance sheet size relative to the debt burden instead of sticking to their current shrinking plan, we could have one less thing to worry about. It’s possible that we could see a recovery soon. One potential solution to alleviate some of the current pressures could be a revaluation of gold, as it hasn’t been adjusted since 1973. This would give the treasury a huge windfall, help yields to move lower so US debt can be refinanced and so they can get down to stimulating.
Conclusion
While there may still be some downside risks, it’s possible that much of the market’s recent challenges have already been priced in, and my strategy doesn’t focus on timing the tops or bottoms perfectly. What I like to do, is catch the meat of a move, whether it’s individual stocks or indexes. I know it’s very cliché advising people to buy when there’s fear and sell when there’s euphoria, but the reality is, it’s hard to not fall into the psychological trap and sell at the lows.
One thing I can say with accuracy is, sentiment moves the market more easily and faster than many real market contagions, both to the downside and upside. This does give us a lot of volatility, but that can also give us a lot of opportunity and that’s what I see here. Opportunity to buy more of my favourite stocks with some very generous discounts. Will I have the chance to buy even cheaper? Maybe, but I don’t want to worry about timing when I’ll do well, given enough time, buying stocks I love over the next 5 years at today’s prices with a 25% to 50%+ discount.
This communication is for information and education purposes only and should not be taken as investment advice, a personal recommendation, or an offer of, or solicitation to buy or sell, any financial instruments. This material has been prepared without taking into account any particular recipient’s investment objectives or financial situation, and has not been prepared in accordance with the legal and regulatory requirements to promote independent research. Any references to past or future performance of a financial instrument, index or a packaged investment product are not, and should not be taken as, a reliable indicator of future results. eToro makes no representation and assumes no liability as to the accuracy or completeness of the content of this publication.