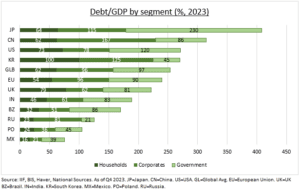
DEBT: The world’s rising debt mountain is a worry, but comes with silver-linings. The bad news is that the mountain grew to over $300 trillion last year. Equal to $39,000/person on the planet. As government debt rose, with fiscal deficits stuck above pre-pandemic levels and election timetable heavy. More positively, the global debt-to-GDP ratio fell for a 3rd year. As inflation driven nominal economic growth more than offset this government debt build. And companies and households deleveraged. Reflected in resilient consumption and narrowed corporate credit spreads. The wide differences in global debt levels tell us a lot about the policy stakes ahead.
ASIA & EM: Japan has by far the world’s highest government debt (see chart) level. This is one reason its policy interest rates have been negative for over 15 years and authorities pursued a yield curve control (YCC) policy. This will restrain how far the BoJ can go in now raising interest rates. China has by far the world’s most indebted corporates. A driver of the authorities’ property market deleveraging crackdown. And its caution on an over-stimulating policy response to the current growth malaise. Emerging markets are mostly lowly leveraged, given their more limited financial options. But this also explains their resilience to the interest rates and US dollar surge.
US & EUROPE: The US enjoys the unique exorbitant privilege of the dollar, and is the world’s largest economy. But it’s high and rising government debt levels are an increasing worry. With recent rating agency downgrades below AAA, large fiscal deficits despite the strong economy, and seemingly little political willingness on either side of the aisle to address. This raises the risk of an unpredictable future ‘bond vigilante’ event. Europe’s consumers are some of the world’s least indebted. Part explaining the continent’s resilience through this economic downturn. Whilst its companies are deleveraging from high levels, helping credit spreads ease to a two-year low.

All data, figures & charts are valid as of 14/03/2024.


