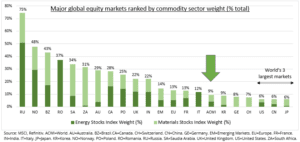
COMMON DENOMINATOR: The world’s best (or least bad) performing equity markets this year, from Brazil (EWZ) to UK (ISF.L), have one common denominator. A big commodity stock weight (see chart). These have followed surging commodities higher. Global equities missed this as the world’s 3 largest markets (US, Japan, China) have the lowest commodity exposures. We see high-for-longer commodity prices, but more volatility at these increasingly extreme prices. Related stocks have better risk/reward than physical, with low valuation and break-even buffers.
LAGGING STOCKS: Energy equities (XLE) are +30% this year, and the OilWorldWide smart portfolio +15%, both trailing the +50% Brent rally. Similarly, industrial metal equities are +10% vs physical industrial metals +30%. Stock investors are grappling with 1) the sustainability of such high commodity prices, potential ‘windfall’ taxes, and Russia-related write-offs. Also, 2) the ‘terminal value’ problem of how to value a fossil fuel industry in terminal long-term decline.
RISK/REWARD: This is better in commodity stocks than in physical commodities. Related stocks will move higher with better physical prices. But also offer some unique downside protections. Even the commodity prices of last month are well-above break-even producer levels. This is under $50 for new oil projects and c$1,100 for gold companies. They will make strong profits and pay big dividends even with much lower prices. Also, energy and materials stocks are the 2nd and 3rd cheapest sectors in the market (after Financials), mitigating the valuation risks.

All data, figures & charts are valid as of 09/03/2022

