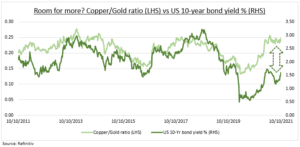
HIGHER BOND YIELDS: US 10-year bond yields have been rising (prices falling), and have more to go. The Fed is to buy less bonds and inflation and growth are both rising. This will drive more investment style rotation to so-called Value (IWF) from Growth (IWD), and help sectors like financials (XLF) and energy (XLE). There are many things to cap this rise, from high debt to demographics and tech, but the copper/gold ratio points firmly to modestly higher yields ahead.
COPPER/GOLD RATIO: The ratio (see chart) shows the number of ounces of gold needed to buy a pound of copper. This is a long-standing market barometer for both risk appetite and bond yields. The predictive power is driven by their respective uses. Gold as the longest standing safe-haven asset, and copper the opposite. Copper has among the broadest industrial uses, from construction to electronics. This led to its nickname ‘Dr Copper’, given for its economics PhD.
WHAT IT TELLS US: The absolute ratio level is irrelevant. But the direction and its movement relative to bond yields tells us a lot. Where divergences open up, like 2011 and 2020, bond yields have ultimately followed copper’s lead. The current ratio level is relatively optimistic. Both for the economic growth (and hence earnings) recovery and it’s call for modestly higher bond yields.
TODAY: Financials (XLF) start Q3 earnings season, led by JP Morgan (JPM). Expectations are for 17% earnings growth, with focus on loan growth recovery, and profit margins, as US 10-year bond yields been rising. Trading activities have been strong, with record deal making activity.

All data, figures & charts are valid as of 12/10/2021

