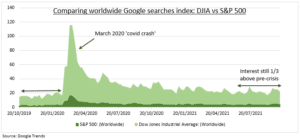
INDEX TITANS: S&P 500 (SPY) and Dow Jones Industrial Average (DIA) are the two iconic US indexes that dominate global equities, and now back at all-time highs. The 500-stock S&P seems a better reflection of US equities, has much more money tracking it ($11 trillion), and we often use it as a market shorthand. But the 30-stock DJIA is broadly much better-known, reflecting its 125-year age and simplicity. It has four times the Google Trends eye-balls, especially in crisis (see chart). This also highlights that interest in US stocks remains well-above pre-crisis levels. Our current preference is for the more growth-sensitive and cheaper DJIA.
HOW THEY DIFFER: SPY is more diversified (500 stocks), more tech and communications heavy (38% weight), and market-capitalisation weighted. DIA is smaller (30 stocks), weighted by its stock price, excludes utility and transport stocks, and focused on industrials (17% weight) and financials (16%). This gives the DIA a larger average company size and cheaper valuation.
PERFORMANCE: These characteristics can drive big performance differences. SPY led by 4% this year, and over three years, given the tech boom, but underperformed longer term. There is little overlap among the largest holdings. DIA is led by UnitedHealth (UNH), Goldman Sachs (GS) and Home Depot (HD). S&P 500 by Apple (AAPL), Microsoft (MSFT), Amazon (AMZN).
TODAY: Top-10 US stock Tesla (TSLA) was the biggest to report earnings so far. It beat high expectations, supporting recent rally. EPS was 17% above forecast. Auto gross profit margin up at 30%. This was way ahead of peers and despite supply chain challenges, after deliveries +73%.

All data, figures & charts are valid as of 20/10/2021

