
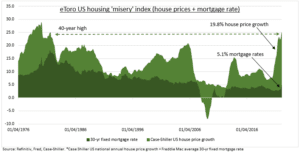
CRACKS: US housing is its least affordable in forty years, per our US housing ‘misery’ index (see chart). This combines the 20% surge in average house prices with over decade high 5%+ 30-yr fixed mortgage rate. This affordability double-whammy is hitting housing activity. The lumber price ‘lead indicator’ is -35% past month (90% US houses timber), new home sales just fell 17%, and US homebuilders (DHI, LEN, PHM) underperforming. But systemic risks are low, with consumer balance sheets strong, whilst a slower economy and inflation will calm Fed fears.
NOT ONLY US: The US is an extreme house price example, but rising house prices and now interest rates are global. Our UK housing ‘misery’ index is near decade highs, with 11% house price growth and 5-yr mortgage rates over 2%. But country differences matter. Home ownership levels range from 90%+ in eastern Europe, to 65% in US/UK/Aus., but 50% in Germany, HK. Similarly, with financing. Shorter-term variable rate mortgages are more common in Europe.
IMPACTS: A sharpening US housing slowdown will keep dampening consumer confidence and the ‘wealth effect’, but with little systemic risk given the strength of household balance sheets. Housing is c.17% of US GDP, split between construction and remodelling at 5%, and housing services, which includes rental payments, at 12%. The slowdown will ease Fed inflation concern, with housing a huge 30% CPI basket weight, and take pressure off the aggressive hiking cycle.
All data, figures & charts are valid as of 24/05/2022