


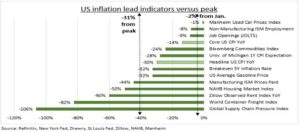
INFLATION: US inflation was most important number in markets. Driving the ‘data-dependent’ Fed, rate hike forecasts, recession risks, and earnings expectations. The S&P 500 has seen an average 2% move on ‘inflation day’. This has now been overtaken by financial system concerns, that are tightening conditions. Combatting these was the reason for the Fed founding in 1913. Our inflation tracker (see chart) shows a stalling prices fall. 5 of our 12 indicators rose last month, led by housing, jobs, and car prices. Fed officials are in a quiet period ahead of March 22nd FOMC, with market pricing now dramatically split on whether we see a rate hike or not after SVB failure. A strong or weak US inflation report today could decisively tip this decision.
STALLS: 5 of our 12 indicators rose vs January. Housing firmed. NAHB’ housing index strongly rebounded and average rents rose 6%. This is particularly unwelcome as biggest portion of the inflation basket. Used car prices rose 4%, the manufacturing prices paid PMI rose 15% and services employment by 8%. Consensus is looking for a small 8th straight headline CPI fall from 6.4% to 6.2%, but core prices flat at 5.6%. The Fed’ NOWCast forecasts a similar price fall stall.
FALLS: Most of our indicators are still falling, just at a slower rate. Down 31% from peak and 2% past month. Supply chains have completely eased, with lower container rates. Both market and consumer inflation expectations easing. As have gasoline and commodity prices. We track 6 segments: labour (employment ISM, JOLTS), housing (Zillow rent, NAHB index), goods (Used cars, Manufacturing ISM prices), commodities (Gasoline, broad commodities), supply chains (supply chain index, container rates), and inflation expectations (Michigan survey, Break-evens).
All data, figures & charts are valid as of 13/03/2023