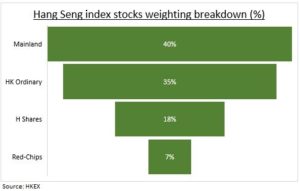
GATEWAY: Hong Kong (HKG50) is the world’s fifth largest equity market and has led the recent global equity rally. It’s the gateway to China, which is now reopening its economy, supporting its gargantuan property sector, and easing up its tech sector crackdown. It traces its roots back to 1891, a century longer than mainland exchanges. This gives it a unique and confusing makeup. Two-thirds the benchmark Hang Seng index is mainland stocks, with the other third HK focused. It’s dominated by the financials (34%) and tech (30%) sectors. It’s institutionally driven at an est. 65% of turnover vs retail-led mainland markets. Its dollar linked, with HKD pegged to USD since 1983, not renminbi (CNY) denominated. Its still on an undemanding 10x P/E with a 3% dividend.
MAKE UP: The Hang Seng index is a free-float market capitalisation weighted index, made up of 73 stocks. This is confusingly divided into four stock groups (see chart). 1) Mainland stocks, whose primary listing is in Hong Kong lead. Think Tencent, Alibaba, Meituan, JD. 2) Hong Kong ordinary stocks, like HSBC, AIA, HK Exchange follow. 3) ‘H Shares’ are mainland listed stocks that also trade in HK, like China Commercial Bank, Ping An, and ICBC. 4) ‘Red-Chips’ are state owned mainland stocks also traded in HK, like China Mobile, CNOOC, and China Resources.
EXPOSURE: Hang Seng is +50% from its October low, leading the Chinese equities move, and outpacing the 14% S&P 500 return. This took its fwd P/E ratio back to an undemanding 10x. Still a 10% discount to Chinese equities (MSCI China), its own 10-year average (11x), and a 35% discount to its February 2021 high 15.5x high. Earnings growth forecasts have been holding firm around 14%. Whilst the index carries a sizeable 3% dividend yield, given the big banks weight. For those looking for focused exposure, the MSCI Hong Kong (EWH) is just HK ordinary stocks.

All data, figures & charts are valid as of 30/01/2023


