


DOWNBEAT: 2022 saw a painful twin inflation and interest rate shock, amplified by geopolitical tensions. This drove significant losses across almost all asset classes. The S&P 500 fell 19%, in its worst year since the 2008 global financial crisis – though after near doubling in the prior 3 years. US Energy stocks beat Communications by 105%. High Dividend outperformed Growth by 32pp. The US aggregate bond index fell 12%. Consensus expectations are downbeat and fearful of the year ahead. But consecutive down years are rare, for equities or bonds. History is on your side with an average 18% S&P 500 annual gain. January performance typically gives a good lead on the year. A fast inflation fall is the fundamental driver, and we believe underway.
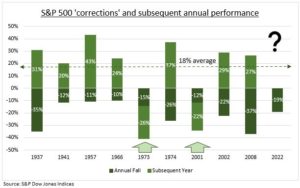
HISTORY: The S&P 500 has seen nine prior 10%+ ’corrections’ over the past 75 years. Seven have seen subsequent positive years, averaging an 18% gain (see chart). The two that did not saw worse falls, of over 20%. These were in 1973, with the ‘Nixon shock’ and oil crisis, and 2001, with ‘tech bubble’. This very rare consecutive fall was also true for the NASDAQ and for a 60/40 US stocks/bonds portfolio. More broadly, the S&P 500 saw 21 annual declines of any size since WWII and stocks have risen 18 times (85%) the next year. High yield corporate bonds, that often lead stocks, have never seen a negative back-to-back year (since tracked in 1987).
OUTLOOK: Inflation is the fundamental key. A sharp fall opens up relief from the Fed interest rate shock and slow-building economic recession and supports our positive view. Our inflation tracker gives signs of hope. Watch the ‘January barometer’ that says ‘so goes January, goes the year’. This worked last year, with January’s 5% loss, and over 70% the time in S&P 500 history.
All data, figures & charts are valid as of 02/01/2023