


WORRY: Strong Q1 results from Alphabet (GOOG), Microsoft (MSFT), and Meta (META) again stoked concerns over big-tech’s domination of US markets and the rally this year. That they are just too big and too expensive. This concern is overdone. Big Tech’s index concentration is not new, dramatic, nor unprecedented. And we see plenty of reasons its high valuations justified. Five largest S&P 500 stocks (AAPL, MSFT, AMZN, GOOG, NVDA) totalled over 20% the index since 2019. Vs a chunky 50-year average concentration of 15%. In the 1970’s ‘nifty fifty’ growth stock era it hit 25%. The relative performance gap (see chart) is also still small. @BigTech.
BIG TECH: Techs S&P 500 index dominance is large, and its relative P/E valuations are back at c30% premium highs. But we see five clear supports. 1) Earnings are depressed, with profits set to fall 15% this quarter led by Semis and Communications. 2) But management’s willingness and ability to cut inflated pandemic cost bases is high. 3) Whilst the long term growth runway is intact and on-display, from cloud to AI. 4) Alongside the huge financial flexibility of profit margins twice S&P 500, net cash balance sheets, and big buybacks. This is a powerful place to navigate possible recession. 5) Whilst anchored long term bond yields are a further support to valuations.
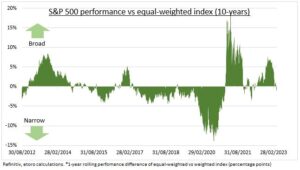
EQUAL: Since its 1970 start the equal-weighted S&P 500 index has beaten its better known weighted sibling by an average of 1.8% a year. It’s been helped by a tilt to smaller size stocks, value, and dividends. Equal weight saw relative strength out of the 2000 tech bubble and 2008 global financial crisis as well as last year. By contrast, it lagged this year as lower bond yields, cost cutting, and recession fears helped tech rebound from its big valuation derating of 2022.
All data, figures & charts are valid as of 26/04/2023