


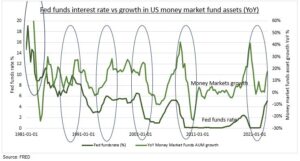
CASH: Cash is yielding the most in fifteen years. This has driven $1 trillion inflows into US money market funds this year. This is money that otherwise would have stayed as bank deposits or maybe found its way into the stock market. Interest rate hikes may have peaked but are set to stay high for a while. 10 months if you believe the futures. Whilst history shows the dash-for-cash does not peak until six months after peak in the Fed policy rate (see chart). This means money market inflows for months more, keeping pressure on banks and denying stocks a flow-of-funds support. Cash is the most held asset, per our Q3 Retail Investor Beat survey, and the most likely to be increased in US, UK, France, Australia, led by the older and wealthier.
BANKS: US money market funds are booming, with assets at near $6 trillion. This is boosting competition with banks. The average 1-yr certificate of deposit is 1.7% per Bankrate. This is up to 350 bps lower than for many money market funds. And without the benefit of its near instant access. Overall bank deposits are down $800 billion since the March bank scare highs. This has been felt most keenly by smaller banks, and comes on top of headwinds from tighter regulations through to weakening commercial real estate markets. Continued stress is evident with the record $107 billion bank demand for the Fed’s pricey emergency Bank Term Funding Program.
STOCKS: It’s also a problem for stocks. The 5.5% yield on short term Treasury bills now exceeds the 5.1% earnings yield (inverse of the S&P 500’s forward P/E of 18.5x) for the first time this century. This likely continues the drip-drip outflows from US stocks. And compared to the modest inflows to overseas stocks and to bonds. A key offset has been still chunky company share buybacks, which remain as the biggest US stocks buyer, at around $200 billion quarterly.
All data, figures & charts are valid as of 02/10/2023.