START: 2023 has started with a performance bang. As lower US inflation and China’s economic reopening have stoked confidence in a nearing Fed rate peak and economic soft landing. Extra fuel has been added by the backdrop of depressed investor sentiment and reset valuations. This has seen last year’s losers like crypto and tech lead up, whilst overseas stocks have led over the US. We are positive about the outlook. The fundamentals are turning less-bad. Whilst history is also on your side. The current 7th bear market rally is typically nearing the sustainable upturn. We believe the market bottom is in but this remains a gradual and a U-shaped recovery, with more inflation and growth bumps in the road to come. Don’t chase this good start too hard.
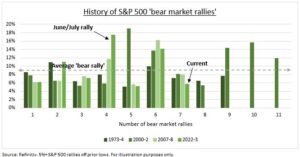
HISTORY: We track the number and size of 5%+ ‘bear market rallies’ in this market sell-off and compare to the crashes of 1973, 2000, and 2007 (see chart). This highlights the large number of bear rallies that are typically seen before the sustainable one arrives that starts the next bull market. But also how far along we already are in this sequence, with the current 7th bear market rally. This adds to other historic supports, including how rare back-to-back market pullbacks are.
EARNINGS: The equity market script has flipped this year. With a lessening inflation and rates shock now coming into better focus. This takes some pressure off of valuations, which was the driver of 2022 weakness. These are now at average levels in US, and well below that overseas. But concerns have mounted that resilient earnings are now set to fall significantly. This makes current Q4 earnings the key short term driver for this rally to continue. We see room for another less-bad earnings season, with low expectations and resilient growth, and some market relief.

All data, figures & charts are valid as of 17/01/2023


