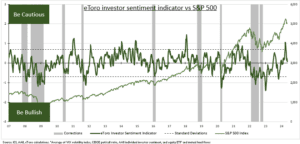
MARKET: US stocks are closing in again on new all-time highs. As Q1 earnings season has validated the slowly broadening earnings recovery. Whilst the Fed has kept the door open to interest rate cuts later this year. The significant levels of cash-on-the-sidelines has been an important technical support. Our contrarian investor sentiment indicator (see below) has retreated to average levels. Unwinding the FOMO (Fear Of Missing Out) that saw it hit a two year high and led to overbought conditions. It’s now a further technical support to the stock market as it faces down still-sticky inflation, weaker seasonality, and inevitable pullbacks.
SENTIMENT: The retreat in our proprietary sentiment index has been led by equity fund flows. They have been negative for six weeks, with mutual fund redemptions outpacing ETF additions. Whilst US retail investor sentiment is modestly above average, though 10 points off highs. The S&P 500 total put/call ratio is near its average at just under 1.0. The standout is the VIX volatility index that has quickly returned to 13, and near its all-time low. Broader indicators are equally subdued. The NAAIM index of net US hedge fund positioning is at 62% versus a March high of over 100%. Whilst US levels of economic policy uncertainty are modestly above average.
INDICATOR: Our proprietary eToro investor sentiment indicator tracks the VIX, fund flows, retail sentiment, and the put/call ratio. A low number is contrarian bullish, with more investors left to turn positive the market. Whilst a high number signals contrarian caution, with investors already bullish. It works best at extreme levels, especially oversold pessimism. Its made up of 1) Equity mutual fund and exchange traded fund (ETF) flows. 2) The long-running American Association of Individual Investors (AAII) sentiment survey. 3) The VIX index of expected 30- day S&P 500 volatility. 4) The S&P 500 put/call ratio, proportion of put buying (option to sell) vs calls (to buy).

All data, figures & charts are valid as of 13/05/2024.


