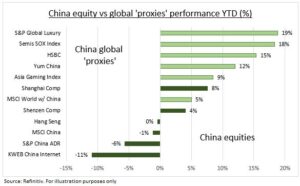
STEALTH: China’s economy is recovering, inflation is low, and stock market P/E valuations are near half of US averages. Yet China’s equity markets have not performed well this year. Due to 1) a domestic and consumer-led economic rebound, with export demand weak and key property market lagging. 2) High expectations after Q4’s big stock rebound. 3) Dampened appetite for Chinese tech stocks when those in the world’s largest market are performing so well. But this understates a stealth stock recovery seen in many, but not all, consumer-focused offshore China proxies (see chart), from luxury to semiconductors and gaming. China’s economic recovery is broadening and it’s a large, counter-cyclical, and uncorrelated market opportunity for investors.
PROXIES: Luxury led Europe’s stock rally this year, and semiconductors the US rally. What they have in common is China. The country represents around a quarter of sales for the big luxury stocks, from LVMH (MC.PA) to Richemont (CFR.ZU. And to Estee Lauder (EL) which sold off sharply yesterday. It is nearer 30% of sales for semis, from NVIDIA (NVDA) to Intel (INTC). Other consumer proxies like gaming, including Sands China (01928 HK), and restaurants, like Yum China (YUMC), have also done well. Laggards have been commodity proxies, like BHP (BHP) and Rio Tinto (RIO), as China’ world-leading metals demand has been slower to recover.
RECOVERY: China is now six months on from the start of its post-covid economic reopening. It has gone smoother than initially feared. And growth is steadily rebounding. Q1 GDP growth surprised on the upside at 4.5%, well ahead of the US and EU. The consumer led with pent up demand driving 10% retail sales growth and the services PMIs to 58. By contrast manufacturing has struggled, with PMIs at 50 and falling exports to US and Europe. Whilst the heavy-weighted property sector is slowly stabilizing, with sales now inching up. China is set to be the only major economy to grow more this year than last, and to contribute a third to total global GDP growth.

All data, figures & charts are valid as of 03/05/2023


