


VIEW: ‘Sell in May and go away’ is one of the most famous adages in finance. This stock market seasonality is strong and very well-supported by the data (see chart). It is even bigger globally than in the US. None of the 15 indices analyzed did better in the next six months than in the prior. This is driven by the calendar of Q1 company guidance and Q4 investors year-ahead repositioning. The fundamentals remain more important, with the top of the interest rate cycle near and growth still resilient. But our positive market outlook is clearly losing a building-block of technical support for the next few months. We focus on ‘new defensive’ big tech, and traditional defensives like healthcare. They can weather the faster economic growth slowdown and equity volatility pick up we see, but stand to benefit from the lower inflation and bond yield outlook.
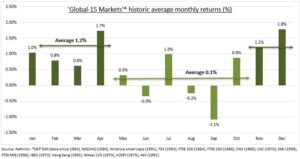
GLOBAL: We analyzed monthly price returns for 15 of the world’s largest stock indices going back on average over fifty years. The monthly average November to April price return is 1.2%, with no negative months. This compares to only a 0.1% monthly return from May to October, and with three losing months. This seasonality difference is seen in all 15 markets. No one see’s stronger returns over the summer months. The greatest price seasonality is in the higher beta assets and markets like the small cap UK FTSE 250 and Italian FTSE MIB. Whilst typical US seasonality is below the global average across S&P 500, NASDAQ, and Wilshire small caps.
SEASONALITY: This resilient seasonality factor has 3 drivers. 1) Q1’s usually positive company guidance on the full year outlook. 2) Q4’s typical investor repositioning for the year-ahead and in advance of the well-known January price effect. 3) Summer months suffer from the lack of these positive drivers, alongside the typically lower-volume summer months. This seasonality is seen even in the southern hemisphere stock markets like Australia. This likely reflects the rise of international investors importance and increased correlations across the global equity markets.
All data, figures & charts are valid as of 27/04/2023