
Summary
Strong capex growth a key earnings driver
Company investment ‘capex’ plans are key to earnings’ growth and the economy. Commodities and tech sectors lead big 18% US capex growth. Has many drivers from strong demand to prior underinvestment, need for efficiencies, and carbon transition. Is a big antidote to recession fears, and most can afford with strong profits. Investments are shifting to technology from ‘traditional’ equipment and buildings. Capex intensity varies a lot by sector, led by energy and telecoms. An issue as rates rise.
Earnings an anchor in the storm
Another volatile week saw decent Q1 earnings, face Russia’s Donbas offensive, more hawkish Fed comments with US, Germany, Japan 10-yr bond yields near key levels, and China’s economy struggling. NFLX price collapse shows danger in missing forecasts. We see markets as sensitive to ‘less bad’ news. See latest presentation, video updates, and twitter @laidler_ben.
Recession risks lower than they may feel
A falling global growth forecast remains above 10-year averages and, along with indicators from trade flows to even the yield curve, a significant buffer to investors recession fears.
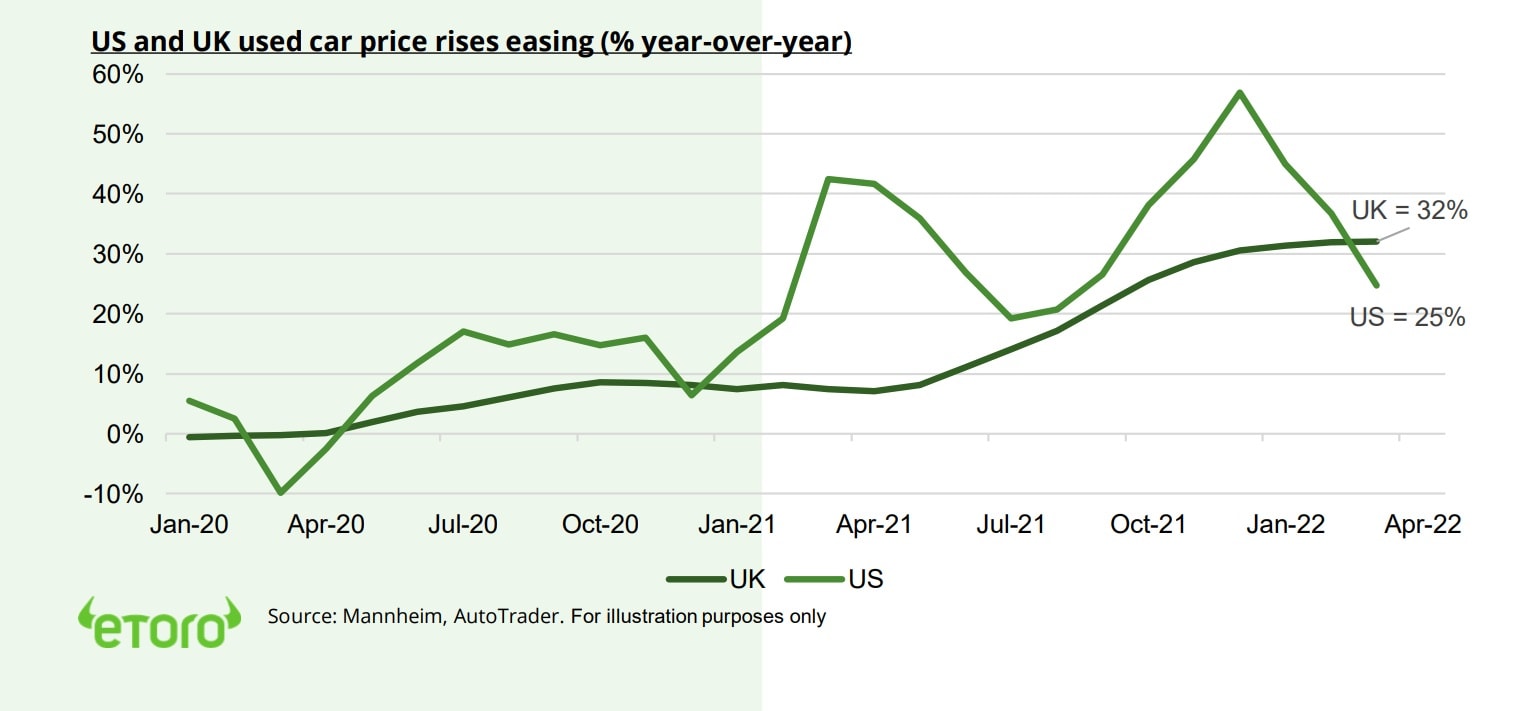
Car price relief a mixed blessing
Soaring used car prices are finally easing as consumers push back. This is good news for inflation but less so for some in auto value chain, like KMX. See @AutoIndustry.
‘Alternative’ assets from timber to PE
Infrastructure, farmland, timber, and private equity are ‘alternative’ assets that can help diversification and are more accessible than ever. FromBIP to WY and BX.
Crypto ownership resilient to the pullback
Our global survey shows 29% investors owning crypto, up 3% in past three months.
US ‘tax day’ passes for crypto assets
Volatile week for crypto with equity swings and April 18 US ‘tax day’ deadline taking BTC and ETH near key $40,000 and $2,900 levels. LUNA boosted as its UST stablecoin gains popularity. eToro adds CRO, KNC, LUNA, ENS to platform taking total coins offered to 62.
Commodities take a performance breather
Commodities ease on USD strength and China uncertainty, after dramatic 30% surge this year. Talk of EU ban on Russia imports supports oil. US natgas falls from 13-yr high as inventories rise. Copper whipsawed by production falls and China demand covid lockdown risks.
The week ahead: Q1 GDP and tech earnings
1) Tech titans AAPL, AMZN, GOOG, MSFT plus big oil XOM, CVX lead US earnings season. All sectors have ‘beat’ so far.
2) US and EU Q1 GDP reports to show slowing economic growth.
3) Central bank focus with higher EU inflation pressure and Japan dovish stance being tested.
Our key views: Sensitive to less ‘bad news’
Markets are relatively resiliently absorbing a lot of negative news, on Fed and inflation to Ukraine and China. This makes them sensitive to the ‘less bad’ news, from Q1 earnings to ‘peak’ inflation data. Focus on a ‘barbell’ of cheap cyclicals and select ‘defensives’: Value, commodities, crypto, alongside healthcare, ‘big tech’, and high dividends. We are cautious on bonds.
Top Index Performance
| 1 Week | 1 Month | YTD | |
| DJ30 | -1.86% | -3.01% | -6.95% |
| SPX500 | -2.75% | -5.97% | -10.37% |
| NASDAQ | -3.83% | -9.39% | -17.93% |
| UK100 | -1.24% | 0.51% | 1.86% |
| GER30 | -0.15% | -1.14% | -10.97% |
| JPN225 | 0.04% | -3.71% | -5.86% |
| HKG50 | -4.09% | -3.58% | -11.79% |
*Data accurate as of 25/04/2022
Market Views
Earnings an anchor in the storm
- Another volatile week saw decent Q1 earnings, face Russia’s Donbas offensive, more hawkish Fed comments with 10-yr bond yields near key levels in US, Germany, Japan, and concern on China’s struggling economy. NFLX price collapse shows danger in missing forecasts. Tech titan earnings and Q1 GDP reports the highlights this week. We see markets as sensitive to ‘less bad’ news. See Page 6 for our Resources guide of reports, presentations, videos, and twitter.
Recession risks lower than they may feel
- IMF cut its global GDP growth forecast for this year from 4.4% to 3.6%, led by Ukraine (-35% GDP) war and higher inflation (5% in developed world) impacts. A similar 3.6% 2023 growth rate is seen. UK/Europe led cuts, with commodity exporters Canada and Brazil resilient.
- Despite the sharp cut, growth rates are above the ten-year average and a buffer to investors recession fears. Other indicators, from trade to PMIs and even yield curve, are as reassuring. Markets are sensitive to any ‘less-bad’ news.
Car price relief is a mixed blessing
- Soaring used car prices have been a big driver of inflation, sign of snarled auto supply chains, and has given automakers, dealers, and renters some rare pricing power. This is starting to change (see chart) as consumer wallets are squeezed. This is a mixed blessing, curbing inflation fears but starting to pressure some auto stocks, like KMX. See @AutoIndustry.
- US Manheim used car price rises have fallen sharply, and UK AutoTrader price rises are stabilizing. New and used car prices have a 7% weight in the US consumer price basket and have made up to 1/3 of price increases. CarMax (KMX), the biggest US used car retailer, recent earnings miss on lower sales volumes and higher bad debt shows the consumer limits.
Look at ‘alternative’ assets from timber to PE
- Investors are looking for more diversification with equities and bonds weaker, and inflation high. Real estate (REITs) was best performer last year. Commodities this. See other ‘alternative’ assets like infrastructure, farmland, timber, PE.
- They tend to be less volatile and correlated, but with good income, tax-efficiency, and history of beating inflation. Access is now easier, with more publicly listed alternatives. Also, many retail investors have similarly long horizons like the ‘Yale model’ endowment investors that have traditionally dominated this ‘alternative’ area.
Resilience of crypto-ownership to pullback
- Crypto rising in popularity, despite recent sell off. 29% of investors in our global survey now own, up 3 points from Q4 survey. More now own crypto than any asset apart from domestic equities. In a decade it became better owned than many bigger and established asset classes. Those who own a lot, at 31% of portfolio.
- This highlights the resilience of the asset class during one of its periodic pullbacks, but also the focus on institutional adoption as the next multi-year driver, with retail already very high.
US and UK used car price rises easing (% year-over-year)
US ‘tax day’ passes for crypto
- Crypto prices near key $40,000 Bitcoin (BTC) and $2,900 Ether (ETH) levels on rising equity volatility. April 18 US ‘tax day’ deadline passed for taxes owed on 2021 crypto capital gains.
- LUNA among the stronger coins, helped by the rising popularity of its USD stablecoin (UST) that now 3rd largest with a $18 billion market cap.
- eToro added 4 new cryptoassets, taking total to 62. Cronos (CRO), Kyber Network (KNC), Terra (LUNA) and Ethereum Name Service (ENS) help Web3 and DeFi via transfers, token exchange, stablecoins, as well as on-chain governance.
Commodities take rare performance breath
- Commodities eased back under pressure of the strong USD, which makes commodities more expensive for most, and rising demand fears in China, the world’s largest commodity buyer. Oil rose on fears of a European ban on Russian oil imports as Donbas offensive launched. US natgas prices fell back from 13-year highs on rising inventories and better weather outlook.
- Copper prices whipsawed by tightening supply and rising demand fears. Big producers Anglo American (AAL.L) and Antofagasta (ANTO.L) saw sharp falls in Q1 production, whilst world no.2 producer Peru see’s more political problems. This was balanced by demand fears from largest importer, China, where covid lockdowns are further sapping economicmomentum.
US Equity Sectors, Themes, Crypto assets
| 1 Week | 1 Month | YTD | |
| IT | -4.09% | -10.14% | -20.28% |
| Healthcare | -4.09% | -3.14% | -7.88% |
| C Cyclicals | -2.62% | -6.45% | -15.22% |
| Small Caps | -3.21% | -7.07% | -13.57% |
| Value | -1.74% | -2.18% | -3.97% |
| Bitcoin | -0.33% | -6.67% | -16.63% |
| Ethereum | -0.67% | 0.97% | -20.68% |
Source: Refinitiv, MSCI, FTSE Russell
The week ahead: Q1 GDP and ‘big-tech’ earnings
- Global Q1 earnings season accelerates with tech titans AAPL, AMZN, GOOG, MSFT, V plus big oil XOM, CVX, and bottlers KO, PEP. 80% of S&P 500 stocks have beaten forecasts so far.
- Initial Q1 GDP reports to show 1% annualised US growth, down sharply from prior 6.9%. Whilst EU to see a sharp slowdown from prior 4.6% year-over-year growth.
- Focus on hawkish central banks. EU inflation (Fri) to pick up more, pressuring ECB and helping EUR, whilst Bank of Japan (Thu) dovish stance has been driving the sharp JPY/USD fall. Fed in ‘blackout period’ ahead of May 4th meet.
- Media industry focus at National Association of Broadcasters (NAB) show, and rail industry with Surface Transportation Board hearings.
Our key views: Sensitive to ‘less bad’ news
- Markets have absorbed a lot of bad news this year. Stubbornly high inflation, more hawkish central banks, China weakness, Ukraine war. This makes them sensitive to any ‘less bad’ news, from Q1 earnings to ‘peak’ inflation data.
- Economies are reopening and growth is still robust. The aggressive Fed hiking cycle is increasingly well-priced and inflation trends near peak levels. Valuations are more attractive.
- Focus a ‘barbell’ of cheap cyclicals and select ‘defensives’: Value, commodities, crypto, with ‘big tech’ and healthcare. Cautious on bonds.
Fixed Income, Commodities, Currencies
| 1 Week | 1 Month | YTD | |
| Commod* | -2.57% | -0.63% | 30.11% |
| Brent Oil | -5.35% | -9.51% | 35.64% |
| Gold Spot | -2.27% | -1.28% | 5.57% |
| DXY USD | 0.61% | 2.36% | 5.37% |
| EUR/USD | -0.12% | -1.65% | -5.03% |
| US 10Yr Yld | 6.61% | 41.71 | 138.23% |
| VIX Vol. | 24.27% | 35.56% | 63.82% |
Source: Refinitiv. * Broad based Bloomberg commodity index
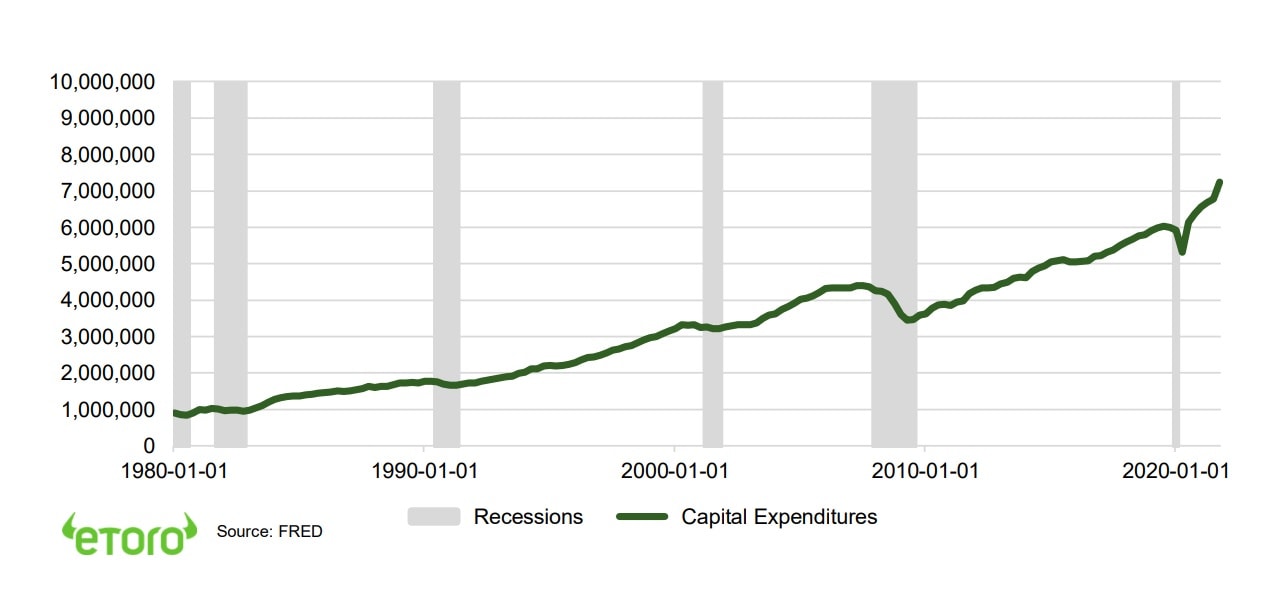
Focus of Week: The capex antidote to recession
Company investment plans are a key driver of both earnings’ growth and the economy
Company investment (capex) is a key indicator of future earnings growth, with an 80% correlation. Capex of one industry is the sales to another. It also provide a clear view of company confidence and of the macro-economic recession risks. CEOs only invest if confident in seeing a profitable return. These investments are over 20% of US GDP and 40% of company cash usage. GDP is made up of Consumption + Investment + Government Spending + (Exports – Imports). Our outlook for double digit investment growth this year is a key driver of our positive earnings and GDP view versus current downbeat sentiment.
Commodities and tech sectors leading strong 18% capex growth rates. A big antidote to recession
US capex accelerated sharply out of the covid crisis, supercharging last year’s GDP boom. Last quarter S&P 500 results showed 18% capex growth year-over-year, with only the real estate and consumer discretionary sectors seeing falling numbers. Commodity sectors energy (XLE) and materials (XLB) led alongside tech (XLK), all at over 30% growth rates. Whilst even staid sectors such as utilities (XLU) and consumer staples saw over 15% growth, driven by carbon transition and automation and efficiency drivers. This continued level of investment growth is inconsistent with investors current concerns over recession risks (see chart).
Investments are shifting to intellectual property from equipment and especially buildings
Capital investments are changing, with the mix continuing to shift away from ‘traditional’ buildings and equipment, and towards technology. Equipment like trucks, trains, and machine tools (roughly proxied by XLI) is only around 40% of total investments, whilst intellectual property like software and R&D is now a similar 40% share. This proportion has doubled over the past 30 years. Whilst investment in structures like factories, power plants and buildings has fallen to only 20% of the total investment pie.
Capex intensity varies dramatically by sector, led by energy and telecoms . An issue as rates rise
Some listed sectors, by their nature, remain disproportionately capital intensive, and therefore potentially more exposed to higher interest rates. Energy, utilities, and communications (telecoms) have the highest absolute capex levels and the highest capex/market cap. By contrast, healthcare and tech have the lowest capex/market cap ratio, despite latter having some of the largest levels of absolute investment.
Many capex drivers, from demand to efficiency and carbon transition. But common ability to afford
Much drives these plans. The strong GDP environment and rising demand requires more capacity, after years of underinvestment. Rising inflation and tight labour markets are driving automation and efficiency. Higher commodity prices are driving investments in those sectors, and the carbon transition in others. Companies can afford these, with near record profitability levels and newly strengthened balance sheets.
US total capital expenditures (US$ millions, since 1980)
Key Views
| The eToro Market Strategy View | |
| Global Overview | Geopolitical risks, the Fed hiking cycle, and China concerns have boosted uncertainty and weakened markets. We see this ultimately fading, the global growth outlook secure, and valuations now more compelling. This still supports a rare consecutive double-digit positive return outlook for the year despite the weak start. Focus on a ‘barbell’ of cyclical assets (Value equities, commodities, crypto) and select defensives (‘big tech’, healthcare). Cautious on fixed income. |
| Traffic lights* | Equity Market Outlook |
| United States | World’s largest equity market (60% of total) seeing strong c4% GDP growth and with room for more earnings upside surprises. Valuations have now fallen back to average levels, and are well supported by still-low bond yields and high company profitability. Fed interest rate risks are now well-priced. See cyclicals and value catch-up, after a decade of underperformance, whilst big-tech is supported by its structural growth outlook. Now see overseas markets leading. |
| Europe & UK | Region is being buffeted by proximity and exposure to the Ukraine crisis. See secure outlook with 1) Europe’s strong macro ‘buffers’ of rising fiscal spending (defence and refugees), zero-bound interest rates (‘dovish’ ECB), and a weak Euro (50%+ company sales from overseas). Equity markets helped by 2) a greater weight of cyclical sectors, and lack of tech, 3) 25% cheaper valuations vs US, 4) decade of underperformance make under-owned by global investors. |
| Emerging Markets (EM) | China, Korea, Taiwan dominate EM, with 60% weight, and is more tech-centric than US. China outlook improving as cuts interest rates (opposite of rest of world) reducing slowdown and property sector risks, focuses on stability ahead of 20th Party Congress, and with valuations now 45% cheaper than US and market heavily out of favour. Will support EM, but is exposed to Fed tightening. China recovery also helps global sectors from luxury to materials. |
| Other International (JP, AUS, CN) | Canada and Australia benefit from strong equity market weight in commodities and financials, as global growth rebounds and bond yields set to rise. Japanese equities among cheapest of any major market and vaccination rates accelerating, but has structural headwinds of low GDP growth, an ageing population, and world’s highest debt. |
| Traffic lights* | Equity Sector & Themes Outlook |
| Tech | ‘Tech’ sectors of IT, communications, parts of consumer discretionary (Amazon, Tesla), dominate US and China. Expect more subdued performance as bond yields rise. But are structural stories with good growth, high margins, fortress balance sheets that justify high valuations. ‘Big-tech’ the new defensives. ‘Disruptive’ tech more vulnerable. |
| Defensives | More attractive as macro risks rise and bond yields better priced. Consumer staples, utilities, real estate attractive defensive cash flows, less exposed to rising economic growth risks, and robust dividends. But also sensitive to bond yields. Healthcare most attractive, with cheaper valuations, more growth, some cost protection. |
| Cyclicals | We expect cyclicals – consumer discretionary (autos, apparel, restaurants), industrials, energy, and materials, to lead performance. Are most sensitive to re-opening economies, resilient GDP growth, and higher bond yield outlook, with more sensitive businesses, depressed earnings, cheaper valuations, and out-of-favour for years. |
| Financials | Financials will benefit from resilient GDP growth, with higher loan demand and lower defaults. Similarly, they benefit from higher bond yields, charging more for loans than they pay for deposits. Sector has cheapest P/E valuation of any, and regulators giving flexibility to pay large 8-10% dividend and buyback yields. |
| Themes | We favour Value over Growth on GDP resilience, lower valuations, rising bond yields, under-ownership after decade under-performance. Dividends and buybacks recovering with cash flows. Power of dividends under-estimated, at up to 1/2 of total long term return. Secular growth of Renewables and Disruptive Tech themes. |
| Traffic lights* | Other Assets |
| Currencies | USD well-supported for now by rising Fed interest rate outlook and ‘safer-haven’ bid on virus fourth wave virus. This is likely more modest than prior USD rallies as rest of world growth recovers and virus fears ease. A strong USD traditionally hurts EM, commodities, US foreign earners, such as tech, but helps EU and Japan exporters. |
| Fixed Income | US 10-year bond yields to rise modestly as inflation above 2% average Fed target, ‘real’ inflation-adjusted yields negative, Fed to gradually tighten policy. Will be modest as inflation expectations already high, wide spread to other market bond yields, and structural headwinds of all-time high debt, poor demographics, and low productivity. |
| Commodities | In ‘sweet spot’ of robust GDP growth, ‘green’ industry demand, years of supply under-investment, recovering China, and Russia supply crisis. Industrial metals and battery materials well positioned. Oil helped by slow return of OPEC+ supply and Russia 10% world supply problems. Gold helped by risk-aversion but held back by rising bond yields. |
| Crypto | Institutionalization of bitcoin market barely begun, as asset class benefits from very strong risk-adjusted returns and low correlations with other assets. Altcoins have outperformed as see broader interest and use cases. Clear supply rules a benefit as inflation rises. Volatility remains very high, with the 15th -50% pullback of the last decade. |
| *Methodology: | Our guide to where we see better risk-adjusted outlook. Not investment advice. |
| Positive | Overall positive view, and expected to outperform the asset class on a 12-month view. |
| Neutral | Overall neutral view, with elements of strength and weakness on a 12-month view |
| Cautious | Overall cautious view, and expected to underperform the asset class on a 12-month view |
Source: eToro
Analyst Team
| Global Analyst Team | |
| CIO | Gil Shapira |
| Global Markets Strategist | Ben Laidler |
| United States | Callie Cox |
| United Kingdom | Adam Vettese Mark Crouch Simon Peters |
| France | Antoine Fraysse Soulier David Derhy |
| Holland | Jean-Paul van Oudheusden |
| Italy | Gabriel Dabach |
| Iberia/LatAm | Javier Molina |
| Poland | Pawel Majtkowski |
| Romania | Bogdan Maioreanu |
| Asia | Nemo Qin Marco Ma |
| Australia | Josh Gilbert |
Research Resources
Research Library
eToro Plus: In-Depth Analysis. Dive deeper into market insights: Read daily, weekly and quarterly summaries, catch up on the latest market trends and get the most recent, in-depth overview of markets.
Presentation
Find our twice monthly global markets presentation on the multi-asset investment outlook.
Webinars
Join our live Weekly Outlook webinars every Monday at 1pm GMT, or watch the replay at your convenience. Also see the other online courses and webinars.
Videos
Subscribe to our timely video updates on market moving events, and the ‘week ahead’ view
Follow us on twitter at @laidler_ben
COMPLIANCE DISCLAIMER
This communication is for information and education purposes only and should not be taken as investment advice, a personal recommendation, or an offer of, or solicitation to buy or sell, any financial instruments. This material has been prepared without taking into account any particular recipient’s investment objectives or financial situation and has not been prepared in accordance with the legal and regulatory requirements to promote independent research. Any references to past or future performance of a financial instrument, index or a packaged investment product are not, and should not be taken as, a reliable indicator of future results. eToro makes no representation and assumes no liability as to the accuracy or completeness of the content of this publication.