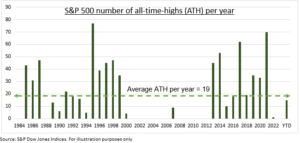
BULL MARKET: The start of a bull market has many definitions, from a 20% gain off lows to the more broadly accepted new all-time-high. The S&P 500 met this on January 19th and has gone on to 15 more this year (see chart). Markets tend to trend. So new highs beget new highs. And history is on your side. With 1-year average returns of 15% and a 90% hit rate after a new high. Whilst the average S&P 500 bull market has historically lasted five years with returns of over 150%. We see the current market as due a breather but fundamentally supported on the twin foundations of 1) a turning earnings cycle and 2) coming interest rate cuts. With manageable tail risk of a services-led inflation turnup, or big tech stumble with record market concentration.
ALL-TIME-HIGHS: The S&P 500 has now seen 15 new all-time highs this year, after a relatively short two-year downturn. This number of all-time highs is below the long-term annual average of 19. And a very long way from the record 77 days set back in 1995. Which was in the middle of the longest-ever S&P 500 rally. That was the 13-year bull market from 1987-2000 that was ended by the tech bubble bust. By contrast, and for balance, the S&P 500 did not see a new high in the twenty-four years from 1930-1954, and only nine new highs between 2001-2012.
BEGET MORE: Looking back to the S&P 500 start in the 1950’s we’ve seen 13 times when a new all-time-high is gained after at least a one-year gap. This has been followed by an average 1-yr performance of +15% and positive over 90% of the time. This speaks to markets continuing the trend unless they see a significant change in fundamentals. This is driven now by the turning earnings cycle and coming interest rate cuts. Inflation is the biggest risk, or a stumble in tech concentration. The fear of investing at highs is misplaced if fundamentals remain supportive, as we see now. But this also explains still only average investor sentiment, a key technical support.

All data, figures & charts are valid as of 04/04/2024.


