
Today we’re happy to announce the release of a new WebTrader version, WebTrader 11.2.
So what’s new in this version you ask? Well we have plenty of little fixes to make the WebTrader run even more smoothly and two major exciting new features.
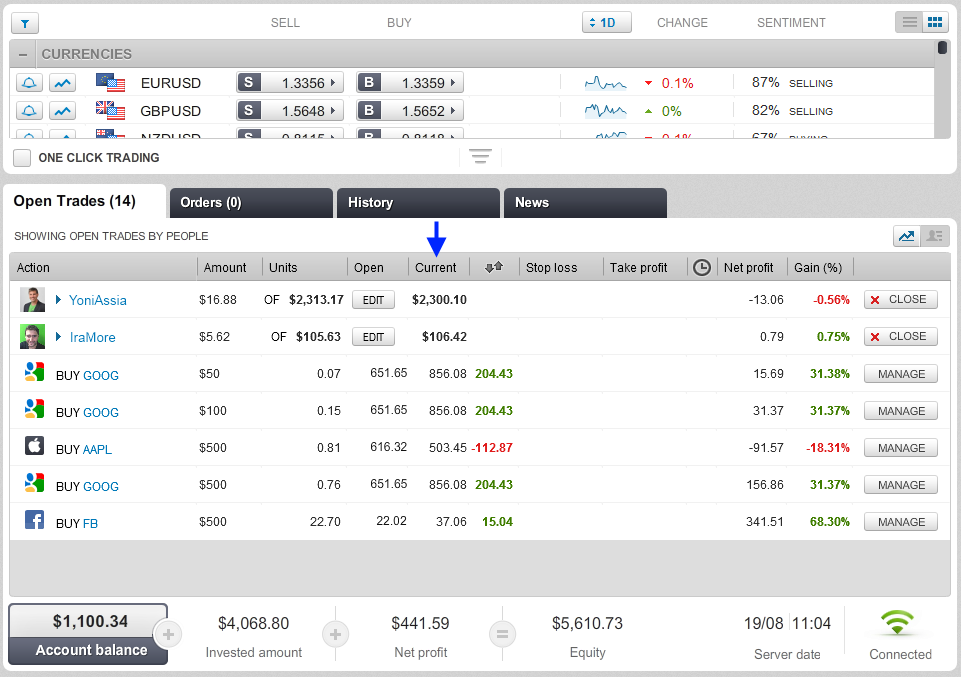
First is the new indication of the current equity value for each copied trader. You can now see the equity under the “Current” column.
The current equity is calculated as the ‘Total invested amount’ + ‘Net profit’ , and the meaning of the equity figure is the amount of money returned to my balance if I stop copying the trader at this moment.
Second feature is a new mode for the ‘Open Trades’ window called ‘Markets’.
The ‘Open Trades’ window can be displayed in ‘People’ view or ‘Markets’ view.
‘People’ view lets us see all of our trades based on the traders who generated them; ‘Markets’ view aggregates all our open trades by instruments (also known as Exposure), meaning that we see one line per instrument which represent the overall exposure to that instrument.
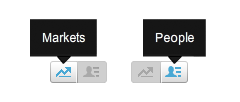
We can switch between ‘People’ and ‘Markets’ by clicking on the icons located on the top right corner
Let’s see how it looks:
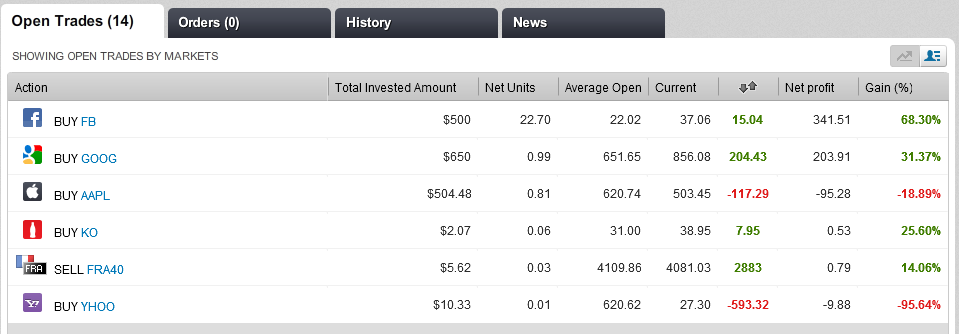
We can see how each instrument has only 1 line representing it.
Now let’s look at 2 examples;
First, we have 2 open trades on the EURUSD
- BUY 4,000 units for $20
- BUY 4,000 units for $40 (two trades with different leverage)

In the ‘Markets’ window they will look like this:
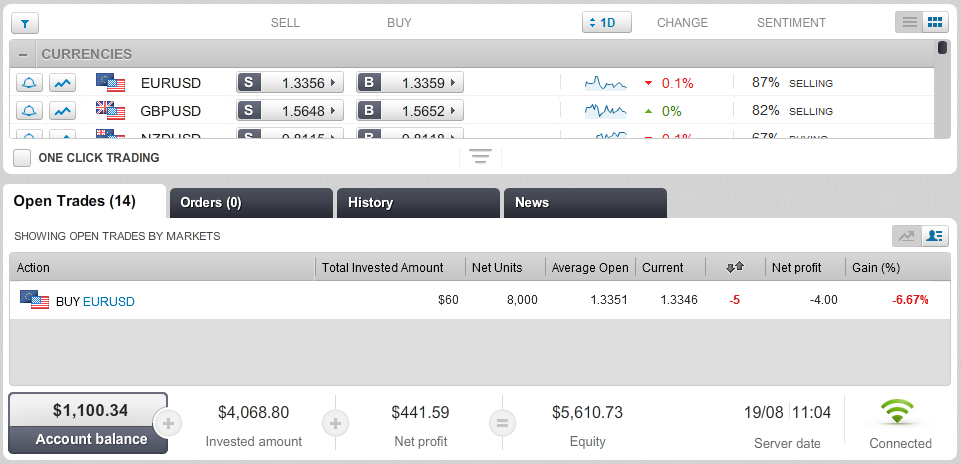
Total invested amount – is the sum of all trades amounts . In current example: $20+$40=$60
Net Units – The net units is calculated as the sum of all units where BUY units are taken as positive and SELL units are taken as negative. In current example: 4,000+4,000=8,000
The trades direction can go 3 ways:
BUY – if the net units calculation ends up Positive, as in our example
SELL – if the net units calculation ends up Negative
FLAT – if the net units calculation equals to ‘0’ , shown in the next example
Average Open – is the price level at which the net profit for all my holdings in this instrument will equal or be as close as possible to zero.
The Net profit is the overall net profits of all the positions in the particular instrument. In the current example: -$2-$2 = -$4
Let’s look at another example, again, 2 open trades, and this time on GBPUSD:
- BUY 4,000 units for $80
- SELL 4,000 units for $40
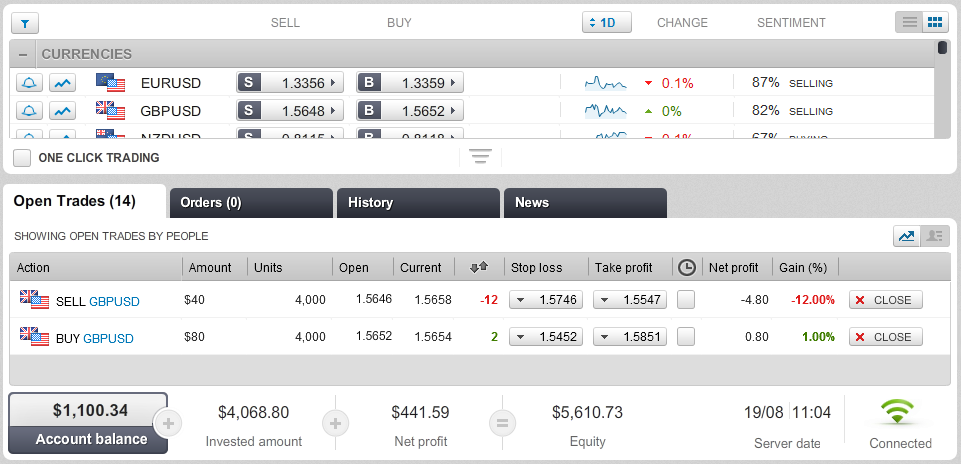
Total invested amount = $80+$40 = $120
Net Units = 4,000 – 4,000 = 0 (no direction)
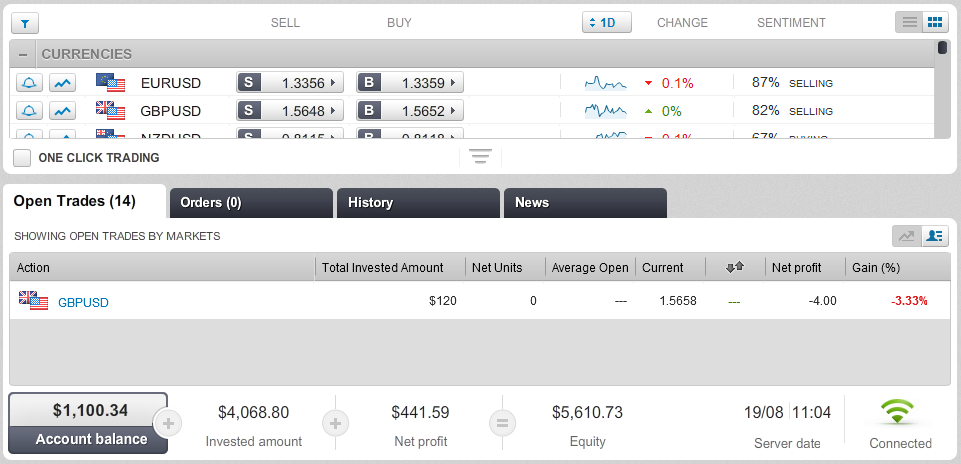
This means that we’re FLAT, the 2 positions perfectly cover each other and price movement can no longer affect the profit/loss we have in these two trades (which stands at $0.8-$4.8 = -$4)
So since the profit/loss cannot change, the ‘Average Open’ and ‘Change’ columns become irrelevant.
The ‘Markets’ view will now look like this:
So what is the Markets view good for?
First, let’s say you have a lot of open trades of your own + lots of copied trades, answering a simple question ‘how much am I exposed in the EURUSD market?’ becomes a difficult task.
Even knowing if you want the EURUSD to go up or down can become difficult. Not anymore.
Secondly, let’s say a big news event is about to be released and you want to protect yourself from expected big market movement, you can now see how much units you hold and open 1 trade in the opposite direction for the same amount of units, thus entering a FLAT mode and protecting yourself from any market movement.
That’s it for this version. As always we invite you to give us any feedback you have on these new features, or any other features that you’d like to see added to the WebTrader.
If you have any questions, don’t hesitate to contact our customer service or community representatives.