We are excited to introduce the new User Statistics page!
With this new page you can now see statistics that will help you evaluate the performance and trading behavior of your favorite investors, enabling you to compose your people-based portfolio according to the trading style that suits you most.
Let’s dive in:
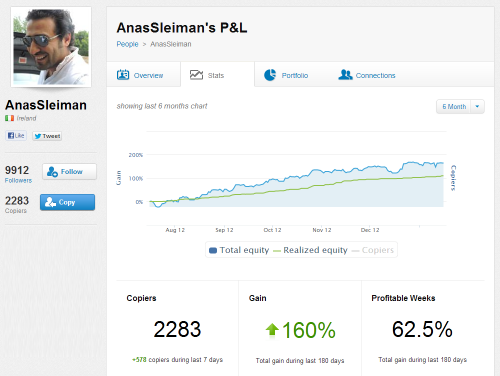
At the top of the page we can see the user’s period performance chart along with 3 key stats:
- Number of people currently copying this trader along with the 7 days’ change.
- Gains accumulated during the chosen time period.
- Ratio of profitable weeks during the chosen time period.
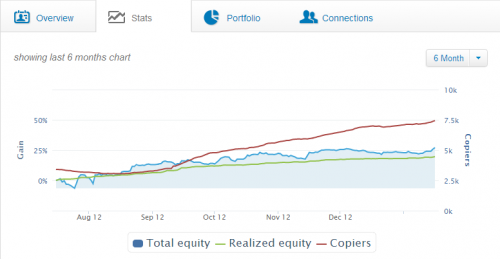
The new chart now includes the option of showing the number of copiers, click on “Copiers” to enable this view:
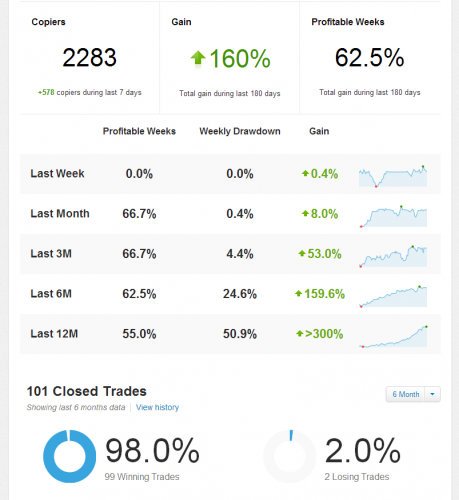
Next we have a summary of the 3 key stats over different time frames:
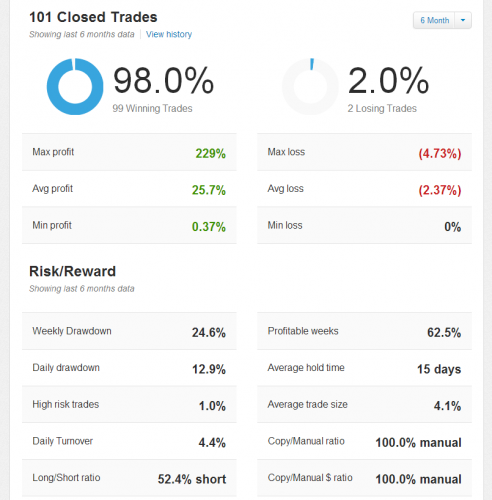
And finally we have a breakdown of the trading behavior this trader demonstrated during the chosen time period:
Let’s see what we can learn from the above figures.
First the hard facts:
This trader has made 101 trades is the past 6 months, a staggering 98% (99 trades) of which ended with profit, and only 2 trades were closed with a loss.
The trader’s average profit per trade is 25.7% so I know what to expect when I copy this trader.
Now let’s take a look at some interesting behavioral statistics.
From this trader’s Risk/Reward stats we can learn that:
- This trader prefers to trade for long periods (15 days on average)
- 99% of the trades are opened with a low leverage, which imposes less risk on the portfolio
- All the positions are manual positions, this trader doesn’t copy others
- The maximum drawdown experienced in a single week was 25% while the total earnings reach 160%, which is a good risk/reward ratio
Overall we can see that these statistics can help us make an educated decision about whether to copy this trader or not.
Moreover, we can now tell when this trader has changed his trading behavior. For example, if he should close a trade with 50% loss or has experienced a daily drawdown of 20%, we would know that this is atypical trading behavior and decide whether we want to continue copying him or ‘sit on the fence’ for a while.
This is of course just the tip of the iceberg. We’ll be adding more new statistics to this page in the near future.
So stay tuned and invest responsibly!


