
We’re excited to announce that we have just released the new Portfolio page on eToro OpenBook which will be available starting 13/1. This page is designed to give you a crystal clear view of your investments, so you are better prepared to manage your investments.
Lets dive in and get to know this new page.
When you first access your portfolio page you get a breakdown of your current portfolio status. All values indicate the current market state, but you can also look at your portfolio performance over a set of different time frames as these include historical trading activities as well.
Choosing a different time frame is easy, simply select your desired time frame from the menu located at the top right corner.
The main figure on top is the Equity figure which tells you exactly how much your account worth is at any moment.
This figure is followed by the current profits and those profits gains derived from the total invested amount.
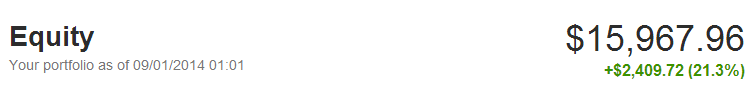
If you choose to see the periodic performance of the portfolio, the equity still shows the current account state but it is now followed by the total profits earned during the chosen time frame.
What you’ll see next is a current equity allocations breakdown of your investments according to the investment type. You can see how much of your equity is distributed over the different investments types in the form of a pie chart.
This is a good time to state that the new portfolio page is unique as it looks at people you are copying the same as any other asset in which you are investing!
Whether you invest in Gold or Copy another trader, you will see how these investments are distributed based on their current value.
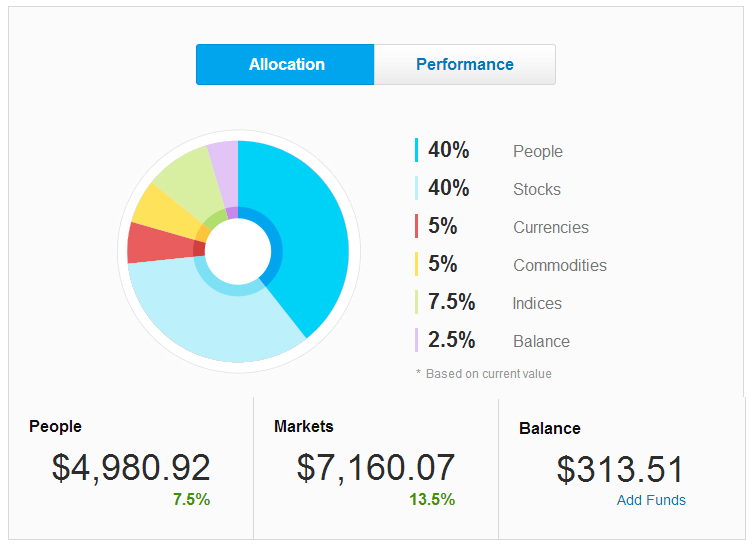
The 3 main figures under the pie chart show you exactly how your equity is currently allocated.
Under “People” you can see how much of it is currently allocated in copying other traders.
In “Markets” you can see how much is currently allocated to your own trades, whether it’s in stocks, currencies, commodities or indices.
The third figure shows how much of your equity is in your available balance.
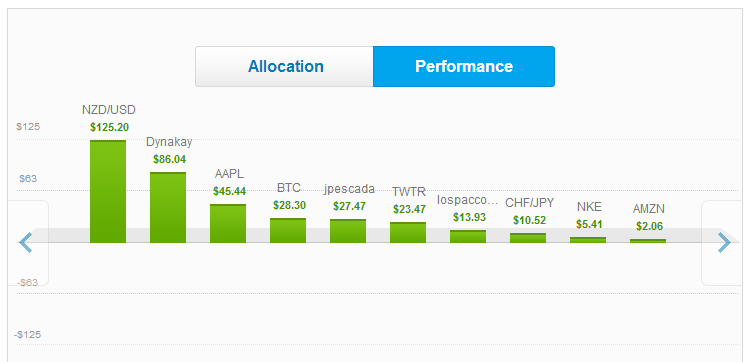
Clicking on the “performance” button switches the view and shows the gains for each investment in your portfolio.
The next part of the portfolio page is the portfolio breakdown table.
This table looks different when you look at the current account state and when you look at periodic account state, such as the 6 months period, for example
First let’s look at the table as it shows the current account state.
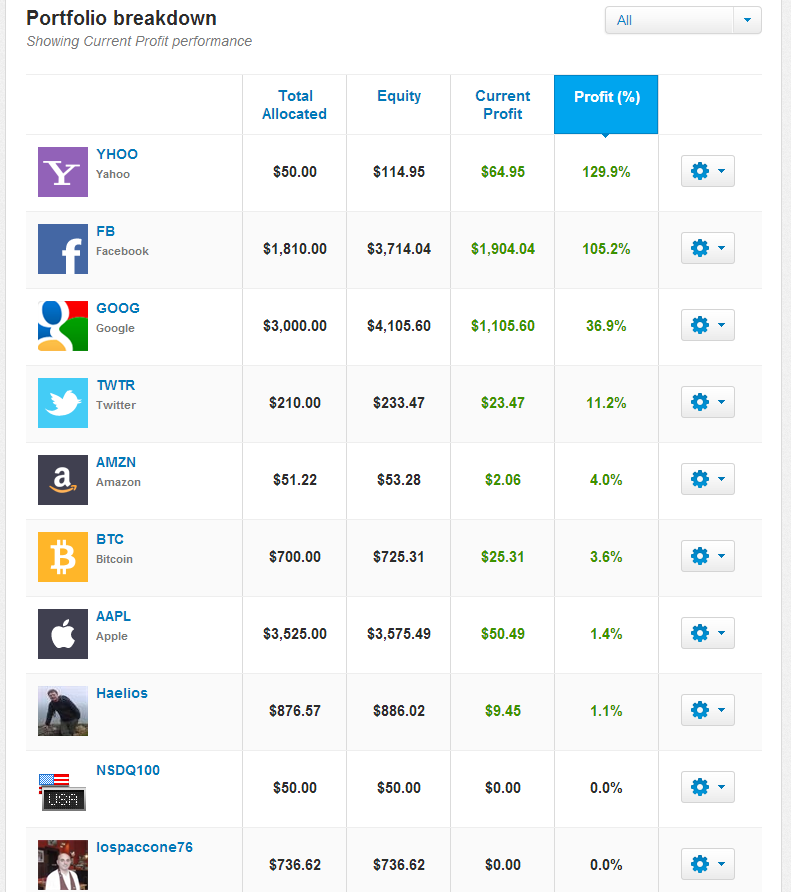
Each item in the chart represents an investment instrument, whether it’s a copied trader, your stocks or your gold trades.
The columns:
- Total Allocated – Shows how much is allocated to the investment instrument, can either be total copy amount if it’s an investment in a specific trader, or the total amount in 10 open Gold trades, for example.
- Equity – This represents the total allocated amount + the current profit (Current value of this investment).
- Current Profit – Represents the total profits of open trades.
- Profit (%) – is the total gain percentage of all open trades, calculated as the current profit divided by the total invested amounts.
Now let’s see how it looks in periodic mode.
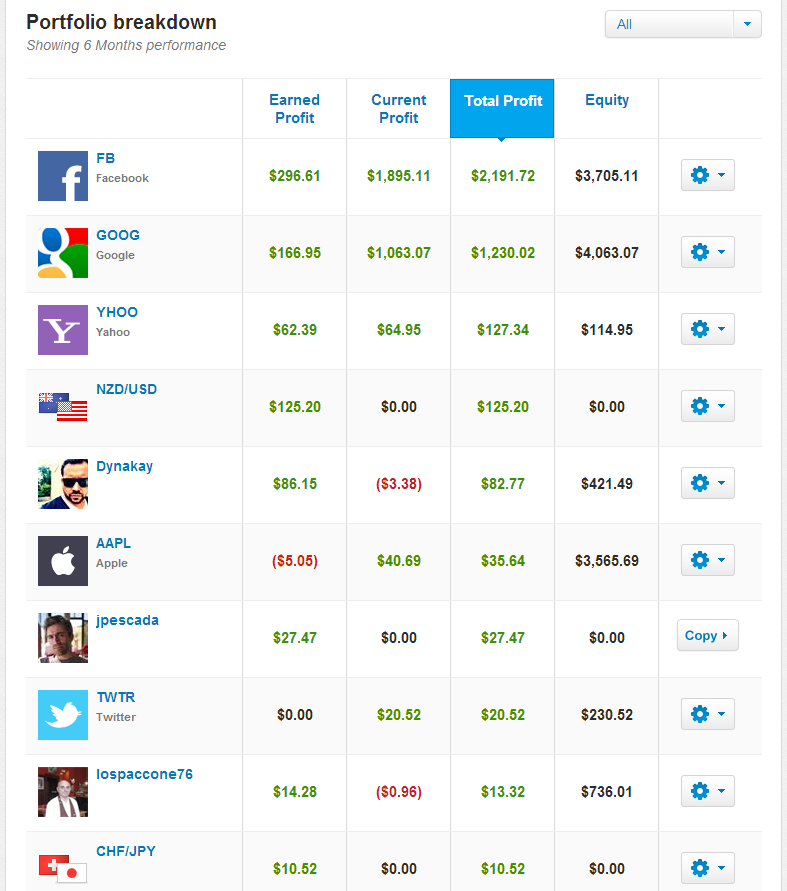
The columns:
- Earned Profit – Represents all profits or loss of closed trades during the chosen time period.
- Current Profit – Represent the total profits of open trades.
- Total Profit – is the sum of both historical and current profits.
- Equity – Represents the total allocated amount + the current profit.
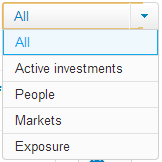
The portfolio breakdown table has 5 different filters. Each filter can be selected from the menu above the table.
The default mode is the “All”, in which you can see all the different investment channels you’ve invested in.
Other modes are:
– “Active investments” – Showing only open trades, or traders you are currently copying.
– “People” – Showing only copied traders.
– “Markets” – Showing only markets you’ve invested in directly.
– “Exposure” – Showing performance according to markets, so you can more accurately measure your exposure in each market in your portfolio, taking in account both manual and copied investments.
So, what are you waiting for? Sign in to the eToro OpenBook right now to check out your new portfolio!
We will soon bring all of these awesome changes to the “Public Portfolio”, enabling you to learn about other users’ portfolio in a similar fashion.
We hope you’ll find these updates helpful, and would highly appreciate your feedback which you can leave here in the comments.