
We are thrilled to announce the all new Popular Investor dashboard!
The dashboard allows our Popular Investors, who are the new generation of money managers, to grow their financial business, by providing them with statistics about their ongoing performance, for the purpose of starting & running their business.
Let’s get straight to business, and show you the ropes of this new exciting feature.
The dashboard is divided into 6 parts, where each serves a different business function:
Overview
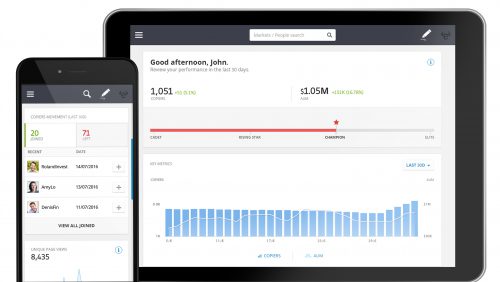
The overview section gives you a bird’s eye view of where you currently stand in terms of performance, by providing you with the two most important indicators about your community:
- The amount of people copying you, and the respective change in the last 30 days.
- Your total AUM (Assets Under Management), and the respective change in the last 30 days.
Copiers & AUM Chart
This section allows you to view your performance over time. You can see the amount of copiers who copied you each day considering a monthly perspective, as well as a snapshot of your AUM per day as of midnight GMT.
Your own CRM
For the first time, you can now see who joined the ride and started copying you!
In the CRM section you can take a look at which copiers started copying you, see interesting stats about their current experience, such as how much of their portfolio is invested in you (we made sure that this doesn’t compromise on users’ privacy), add them to your watchlist, or post on their wall using the ‘Say Hi’ button.
You can also see who stopped copying you, what was their copy P&L when they chose to leave, and what was the reason they left (e.g. stop loss or manual).
Viewed Your Profile
The page views section allows you to see how many users have viewed your profile.
Think of the following scenario: you posted a thorough analysis of your favorite market- but what’s the impact you’ve created? How many potential copiers did you get to view your profile page & stats? This view allows you to see if it made a change, as a spike in your page views means new potential copiers are right at your doorstep, and if you’ve nailed your bio & outperform, you may very well be earning new copiers.
Financial System
The Payments section shows you your recent payments. You can see the payments you received from eToro, as well as the amounts for each month.
Additional Statistics
To seal the dashboard, you’re given statistics about your copiers’ experience, where each tells a story for you to gain actionable insights to act on and improve your standing:
- Average Copy Amount- the average copy amount considers closed copies in the last 30 days, as well as existing ones, whereas high copy amounts may indicate that your copiers have great faith in you, and that you instill trust that is worth investing in, whereas low amounts might show the opposite.
- Average Copy Duration- the amount of time your copiers copy you on average, including existing copies, as well as ones that were already closed (during the last 30 days). A lengthy copy duration may show that you consistently deliver in the long term, rather than just the short term. This may mean that you’re doing a great job in providing with returns & engaging posts, where on the contrary, if you’re volatile, generate losses, or fail to engage with your customers, you might see this metric fall.
- Copiers Profitability- generate positive returns to those who copy you? This metric shows the most important thing users came for, and whether they got it, and continue to get it.
- Net. Cashflows – a clear indicator as to what was the change in your AUM, disregarding market volatility & earnings. It’s the net. of added/removed funds allocated to copy you, for you to really know where you stand in comparison to where you were 30 days ago.