


American writer Mark Twain is thought to have said: “History doesn’t repeat itself, but it often rhymes.”
Each of bitcoin’s biggest bull markets has kicked off within a year of one event: the halving.
These technical network events happen roughly every four years and halve the block reward given to bitcoin miners, effectively reducing bitcoin’s inflation rate by 50%. Moreover, they are thought to be the critical catalyst behind the four year cycle, which has played out repeatedly over bitcoin’s lifetime.
Is the four year cycle a self-fulfilling prophecy?
Aside from historical similarities with previous cycles, there is another important market dynamic at play which suggests a recovery could be on the way.
As the halving approaches, analysts are now generally expecting that prices will rise as they have previously. According to market psychology, this can become a self fulfilling prophecy as investors buy in anticipation of rising prices, thus causing prices to actually rise.
This psychology, along with the fundamental supply reduction of the halving and the unique dynamics of an ever-changing economic environment, mean that although each of bitcoin’s four year cycles has been different, they have all followed roughly the same trajectory.
The patterns of the halving
As we now approach bitcoin’s fourth halving, here are three familiar patterns that reveal exactly which phase of the four year cycle we are in, and most significantly, what we could expect to happen in the next few months.
1. Price action reflects previous four year cycles
Historically, each year of bitcoin’s four year price cycle has been characterized by its own distinctive sentiment and price action:
- Bull market: Following the halving event, Bitcoin rallies on growing excitement and eventually sets a new all-time high.
- Capitulation by price: Bitcoin falls for a year, and many investors panic sell as prices move lower than their entry point.
- Capitulation by time: Bitcoin drifts sideways and creates a sense of boredom in the market, before eventually forming a new bottom.
- Recovery: Prices once again start to rise as Bitcoin embarks on a recovery.
As analysts including Rekt Capital have highlighted, variations of this four year cycle have repeated since the first Bitcoin halving in 2013.
2. We are in the “boring phase”
Bitcoin is now trading in a similar way to previous four year market cycles, as shown in the chart below.
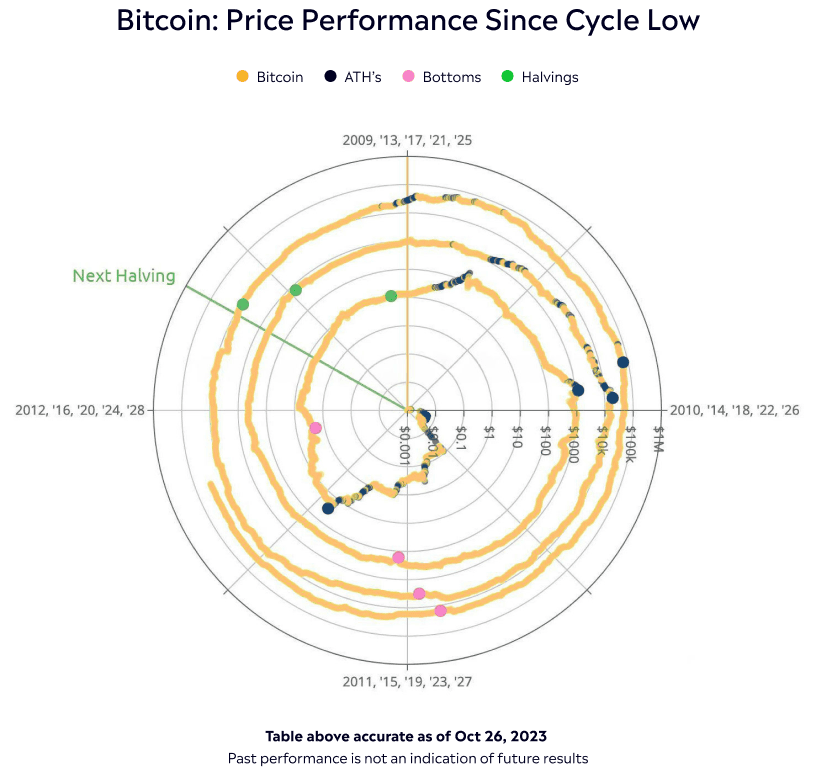
This is shown by the black line on the chart, which indicates that we are now in the third year of the four year cycle. During this period, prices drift sideways as short-term investors get bored and eventually leave the market.
However, if this cycle proceeds like others before it, then this period of boredom will eventually be followed by a recovery around the time of the Bitcoin halving.
3. Long-term holders are accumulating
In addition to patterns of price and time, holder metrics also suggest that we are in a period of the cycle that has historically preceded a recovery.
As bitcoin rises during the heady thrill of a bull market, short-term investors buy and chase the price higher. Then, as prices drop in the following bear market, they grow frustrated and sell their bitcoin.
Meanwhile, long-term holders tend to do the opposite: accumulating crypto when prices are lower in the bear market, and then carefully peeling off profits as prices rise in the bull market
Combined, these behavioral tendencies change the distribution of bitcoin across wallets in each phase of the market cycle: During the bear market, long-term holders end up holding a greater proportion of the total supply while short-term “tourists” end up with less — and vice versa in the bull market.
As data from Glassnode shows, this is exactly what has happened in recent months, with the amount of bitcoin held by long-term holders surging to hit all-time highs at 14.6 million, while the amount of bitcoin held by short-term “tourists” sinks to a low of only 2.56 million.
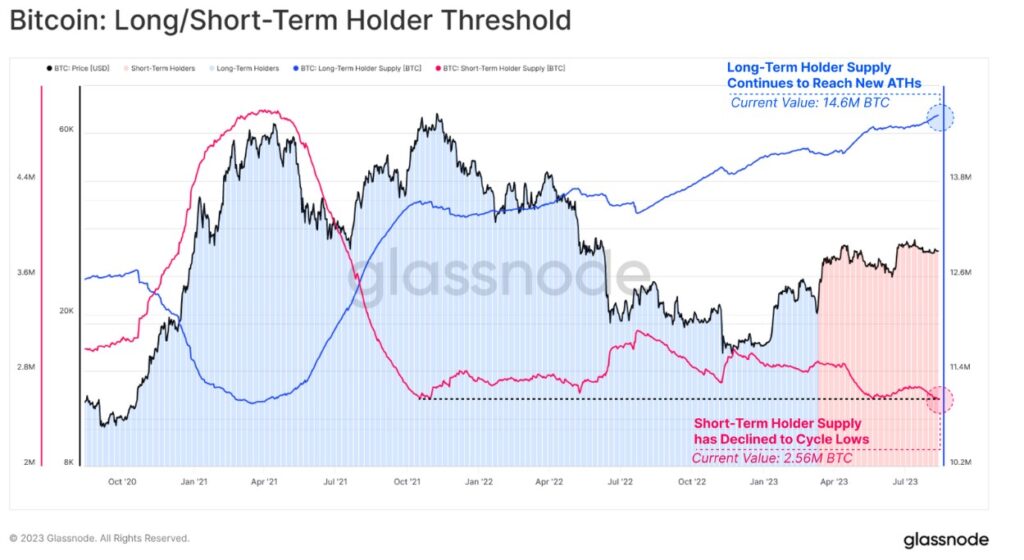
Past performance is not an indication of future results
In the context of historical patterns, this distribution suggests that we are now at the point of the cycle when the pendulum will begin to swing the other way, as prices rise and short-term investors start buying again.