


Key Takeaways:
– Volatility continues to compress after the initial excitement around traditional financial institutions filing for Bitcoin exchange traded funds (ETFs)
– The US based inflows that initially drove Bitcoin to $30,000 have fizzled out at the moment, likely a reflection of the market pricing in delays in approvals for ETF filings
– Trading volumes and liquidity have continued to decline over the last month, reflecting less activity in the market overall
– With the supply halving roughly 10 months out, on a multi-year view, Bitcoin/crypto continues to show striking resemblance to its previous “4 year cycles” (Why not check out our blog post “Where are we in the broader 4-year cycle?“)
Major Crypto Developments for the week:
– MakerDAO’s proposal to implement an enhanced DAI savings rate has passed, allowing DAI holders to earn up to 8% yield
– Total stablecoin market cap has reached its lowest level in two years, as USDC’s market share continues to diverge from USDT’s
– Italy central bank chooses Polygon, Fireblocks to help institutions with tokenizing assets
– Federal Reserve officially announces its instant payment service FedNow with 35 banks and credit unions
– Avalanche Foundation has launched Avalanche Vista, a $50M incentive program to purchase RWAs minted on Avalanche
Upcoming Crypto Catalysts for the ensuing week:
– Litecoin halving set to take place this week on August 2nd
– DYDX is set to unlock 3.81% of supply on August 1st
Market Structure:
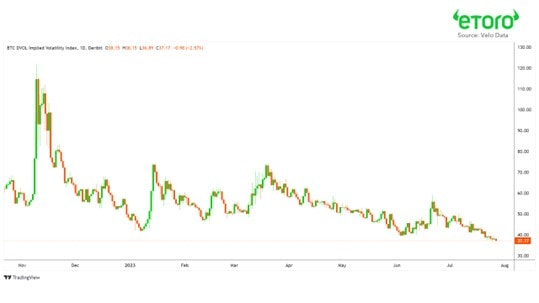
The last month has been incredibly quiet for Bitcoin, with price trading in a tight range. This “boring” market can be portrayed by looking at implied volatility, which is the expectation of volatility for the leading digital asset priced in by the options market. Implied volatility has breached prior 2023 yearly lows, reflecting just how boring price action has been lately, but also the potential for a large impulse on the horizon. This is largely due to a decline in excitement after the initial surge in crypto prices around the Bitcoin ETF filings from Blackrock, Fidelity, and other institutions.
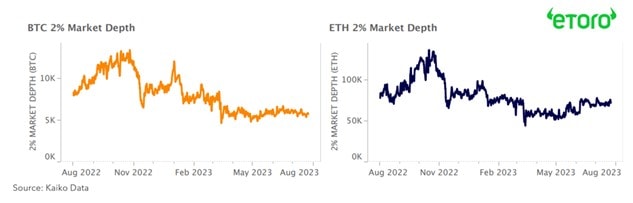
Similar to volume, liquidity is an important measurement for investors and traders in any market to know how easy it is to exit and enter positions in assets without incurring price impact. To measure liquidity, we can look at the 2% bid/ask depth for Bitcoin (left) and Ethereum (right). This looks at orderbooks across major exchanges and measures how much of an asset would need to be bought or sold to move the price up or down 2%.
As we can see in the charts below, liquidity on both Bitcoin and Ethereum have been declining since the FTX collapse. This is due to a combination of counterparty risk in the market, blowups across infrastructure and market making firms alike, as well as regulatory uncertainty for US based firms. Recently, traditional market making firm Jane Street announced that it would be pulling back on its market making operations in crypto entirely.
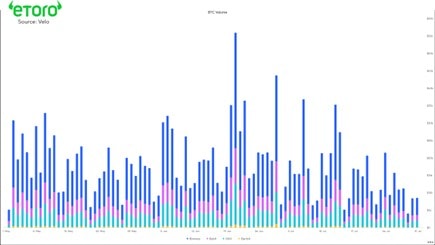
Looking at trading volume for Bitcoin across various crypto exchanges, we can see a continued decline in trading activity after the initial surge of excitement around the Blackrock ETF filing. Volatility, liquidity, and volume are all intertwined data points pointed to the same conclusion: price action for the major cryptoassets has been lackluster lately. For an asset class that historically traded with high volatility, this is unlikely to last for an extended period of time.
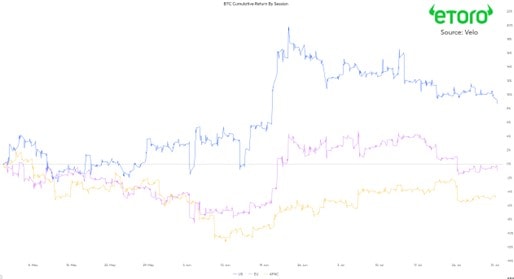
One of the biggest indications of the “ETF trade” being put on by market participants in crypto was the trading hour premium of Bitcoin during US hours relative to European and Asian-Pacific sessions. In blue in the chart below, you can see the initial large surge in positive price action during US trading hours after the ETF filings; showing that the US was driving Bitcoin’s price move up to just over $30,000. With the initial surge of excitement waning, this US trading hour premium has fizzled out over the last month.
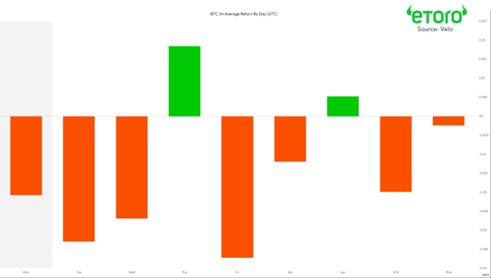
Looking at Bitcoin’s price performance by day, we can see that Thursdays have clearly been the best performing day of the week, with Fridays being the worst performing day of the week.
We hope you enjoyed this week’s crypto market update and look forward to touching base again next week! Maybe you’d also like to check out our blog post “Where are we in the broader 4-year cycle?” Thanks for reading.
The material in this blog post was created exclusively for eToro by Reflexivity Research.