Since becoming a popular investor on eToro, I have been trying to help my copiers learn more about both trading and investing. When it comes to learning a new skill, many people have the tendency to dive straight in at the deep end and sometimes forget that they need to learn how to swim first. This is especially true when learning to trade!
Learning to trade takes a long time and a lot of discipline; a strong foundation of the basics is essential. This blog post was written to help you get started with the absolute basics of technical analysis.
Introduction to candlesticks
When learning about technical analysis, you must first understand what a candle on a chart represents. When talking about candles, we are not referring to the type that many of you have in your homes.
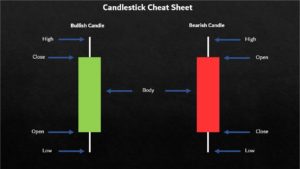
I am sure we have all noticed the red and green candles on a chart before, but what do they actually show us? Simply put, the candles tell us how the price of an asset has moved over a given period of time. If a candle is green, this means that the price of the stock has closed higher than it opened at the start of the specified time range. If the candle is red, this means the price has closed lower than when it opened during the specific time range.
Timeframes
As a trader, it is important to analyse price movement on multiple timeframes. When opening the chart of any asset you are able to select from a number of different timeframes. These range from yearly, where one candle represents the price action of an entire year, all the way down to one minute.
You may have read about someone being bullish or bearish on a certain asset. To be bullish means that you believe the price of an asset will increase, to be bearish means you believe an asset’s price will decrease. When beginning to understand how to decipher those fantastic-looking candlestick charts, the longer period timeframes are useful for understanding whether a particular asset is currently in a bullish or bearish trend (also known as market structure).
What do candlesticks tell us?
The opening and closing prices are shown on a chart by looking at what is called the candle body. On a green candle, the price at the bottom is where price started at the beginning of the timeframe – this is referred to as the “open”, and the price at the top is where price finished – referred to as the “close”. The exact opposite is true when looking at red candles.
Above and below each red or green candle body you will see the wicks. The wicks tell us the highest and lowest prices seen during the specified timeframes, also known as “the range”.
For example, if you were looking at the one-hour timeframe, an asset could have opened at $10 and closed at $20. However, during that hour the price may have risen to $25 or dropped to $5. The wicks provide us with that information and are useful in identifying levels of support and resistance (which I will explain).
Introduction to support & resistance levels
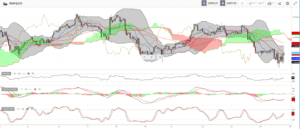
As a new trader, it can be difficult to know what to focus on when using the tools of technical analysis. You will see people talking about all the various indicators out there such as RSI, MACD, and EMAs, alongside the fancier sounding Elliot Waves, Ichimoku Clouds, Stochastics, and Bollinger Bands. This inevitably leads to a new trader’s chart having so many lines and indicators on it that it looks like a Jackson Pollock painting.
Support and resistance levels
Support and resistance levels are a technical analysis tool which can provide investors with an indication as to when an asset should be rising or falling in price.
For example, if you see a stock rising in price, you may begin to wonder how much longer will it continue rising? Is now a good time to invest? The same question could be asked about a stock falling in price. How much longer will the decline continue? The truth is that nobody can give a definitive answer.
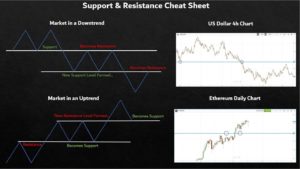
Nonetheless, support and resistance levels are price zones based on the previous performance of the stock, where should the stock rise and reach that zone we would then expect that stock to reverse course since it has hit a resistance zone. Same is true for a stock where the price is dropping. When a drops to a certain zone or area, and hits a support level, we would now expect the stock to reverse course.
Sometimes, the stock continues to rise beyond the resistance level. When that happens, the previous resistance level becomes a support level and a new level of resistance is created. If a stock drops below a support level, a new support level will also be established, and the previous support level will now become a resistance level.
Strength of support and resistance levels
Support and resistance levels that form on the higher timeframes such as the weekly, daily, or 4-hour charts, tend to be good at identifying potential areas for a reversal or continuation of a trend. There are many ways we can add confluence to a support and resistance level and its likelihood of holding, regardless of in which timeframe it is found.
Imagine an elephant standing on a very thick sheet of ice that can comfortably support its weight. The ice holds the elephant up and acts as a support. Now imagine that the elephant invites its friends to join him on the ice one by one. With each additional elephant that steps on the ice, it is increasingly likely to result in the ice shattering. The same is true of support levels. The more times a stock price drops to, and touches, a support level, the more likely it is to break and lead to further decline in share price.
The same is true of resistance levels. The more times a stock price touches a resistance level, the more likely the price will eventually break through and lead to further increase of the stock price (although the elephant analogy does not work here, so you need to think of another one…).
Real chart examples
Before finishing this blog post, I want to share a couple of real chart examples to illustrate the concepts visually. Sometimes a picture makes concepts a lot easier to understand!
Bitcoin example (daily chart)
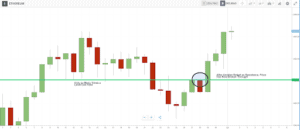
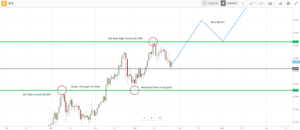
For the first example, I used the Bitcoin daily chart that shows some nice support and resistance level flips. Back around the start of 2021, Bitcoin reached a new high around the $42,400 level and eventually broke through this resistance level at the first time of asking. Over the course of the next several weeks, Bitcoin continued climbing to around $58,000. However, it then experienced a correction of approximately 30%, coming back to retest the previous daily resistance level at the previous high around $42,400.
As you can see from the chart below, this ultimately led to Bitcoin setting its most recent all-time high, at that moment, around the $61,500 level. Based on a very simplistic view of Bitcoin continuing to be in a bull market, and the basic concept of support and resistance, Bitcoin’s next move could very well be breaking through the latest high at $61,500 and eventually coming down to retest that level and turn it into support.
This chart also perfectly illustrates that support and resistance levels should be viewed as zones, rather than pinpoint accurate levels.
Ethereum example (daily chart)
This example illustrates a concept discussed earlier in the blog in relation to the strength of a support or resistance level. In the chart below, from early 2021, you can see that Ethereum has spent a long period of time hovering around the $1,700 level.
You can see in the cart that this is an important level for Ethereum; it has acted as both support and resistance many times on the daily chart. On the most recent test of the level as support, you can see that it was tested around eight times before eventually seeing Ethereum drop below $1,700 again.
Summary
Hopefully, some of you have found this blog useful. Learning to trade profitably takes both time and discipline, but acquiring a solid foundation in technical analysis will give you a great starting point. I am always happy to talk about technical analysis, share my opinion, or answer any questions you may have, so please feel free to reach out to me on eToro!
Andy Cleaver is a Popular Investor on eToro. He prefers a low-risk portfolio and strives to beat the major indices over the course of each year. When Andy invests in long-term holdings, he looks for companies who will continue to provide value in the future.
Discover eToro’s Popular Investors
CFDs are complex instruments and come with a high risk of losing money rapidly due to leverage. 67% of retail investor accounts lose money when trading CFDs with this provider. You should consider whether you understand how CFDs work and whether you can afford to take the high risk of losing your money.
Copy trading is a portfolio management service, provided by eToro (Europe) Ltd., which is authorised and regulated by the Cyprus Securities and Exchange Commission.
Cryptoasset investing is unregulated in some EU countries and the UK. No consumer protection. Your capital is at risk.
Copy Trading does not amount to investment advice. Your investments value may go up or down. Your capital is at risk.

