


Divergence analysis can help you to identify trends when trading or investing. Regular divergences suggest a trend may stop or reverse, while hidden divergences imply a trend will continue despite apparent weakening. Positive divergences point to rising prices, and negative divergences indicate falling prices. By using divergences as a leading indicator, traders can optimise their trading strategies in line with trends.
Divergences are a critical technical analysis tool for traders aiming to spot early signals of market reversals and to be able to adjust their strategies accordingly. The process involves comparing price charts to charts of indicators and identifying moments when those two data sources no longer give the same trading signal. If one is indicating buy, and the other selling, with further analysis you can identify if those signals point to a trend continuing or reversing.
The basics of divergences
Divergences are a form of technical analysis that uses indicators to give an insight into the strength of a current trend. Those indicators include the relative strength index (RSI), moving average convergence divergence (MACD) and the stochastic oscillator.
Those three indicators all offer a slightly different interpretation of market mood by using a data set more extensive than price and time as logged on a straightforward price chart.
Often, the readings from price charts and indicators will align and both point to the same course of action: either buying or selling an asset. However, if those two readings diverge, a trader has more to consider.
Some of the elements of divergence analysis are quite nuanced, as different types of divergences can signal different things.
- For instance, one could signal that a price chart trend might be about to end, and trading in the opposite direction is advised.
- Another divergence could signal that although a short-term correction has taken place, momentum is still building, which means that there is an opportunity to build exposure to the current trend (potentially at a better price).

Types of divergences
- A “regular divergence” signals that a trend is about to stall or reverse.
- A “hidden divergence” suggests that the trend will continue, despite the price chart showing signs of it weakening.
Both use the same methodology and analysis techniques, but the different directional signals are based on how traders interpret the details of the patterns shown. With a trader’s main aim being to know in which direction markets are headed, there is also another way that divergences can be categorised:
- A “positive divergence” points to the price of an asset soon rising.
- A “negative divergence” points to a price soon falling.
Tip: Use different indicators to analyse the same situation, and check which confirms that a divergence has occurred.
Significance of divergences in market analysis
One of the criticisms of technical analysis is that because it is based purely on historical data, it is better equipped to tell you where markets have been, rather than in what direction they are heading next.
The significance of divergence analysis is that it can be used as a leading rather than a lagging indicator, which makes it a potentially powerful tool.
Divergence analysis is also important because it can help your trading bottom line. With one of the core elements of many trading strategies being trading with the trend, the ability to spot times when trends are about to stop and possibly reverse is crucial when trying to optimise returns.

Identifying divergences in charts
Divergences are identified by using charting techniques. This involves tracking the highs and lows of a price chart and that of an indicator and identifying if they are making higher highs and higher lows, which is a classic bullish pattern, or lower highs and lower lows, which is a bearish pattern.
Regular divergence signals are found by tracking the lows of your price and your chosen indicator during a downtrend, and the highs of your price during an uptrend. The situation is flipped if you are looking for hidden divergence, in which case the approach tracks the highs of a price and your indicator during a downtrend, and the lows of a price during an uptrend.
Tip: Indicators can be set to be displayed inline or histogram form, and both visual formats can be beneficial.
Divergences: Practical examples and interpretations
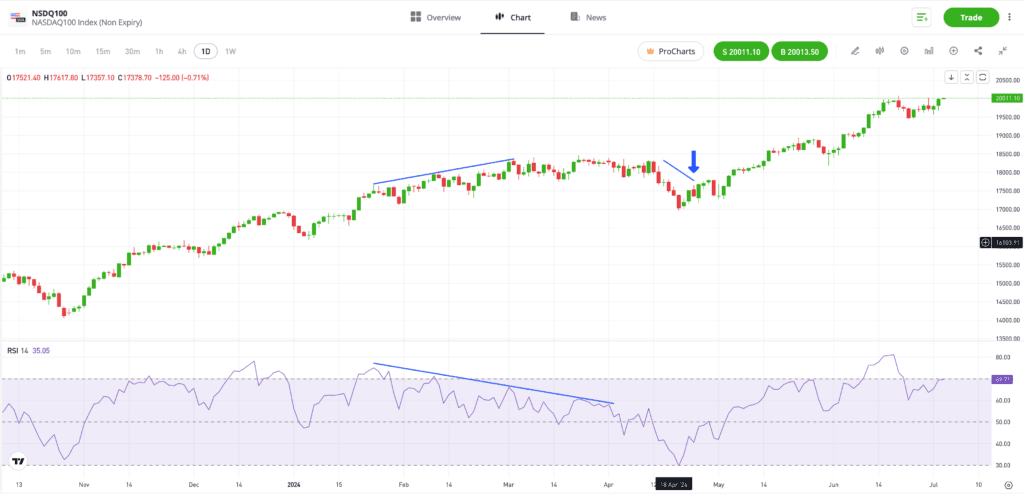
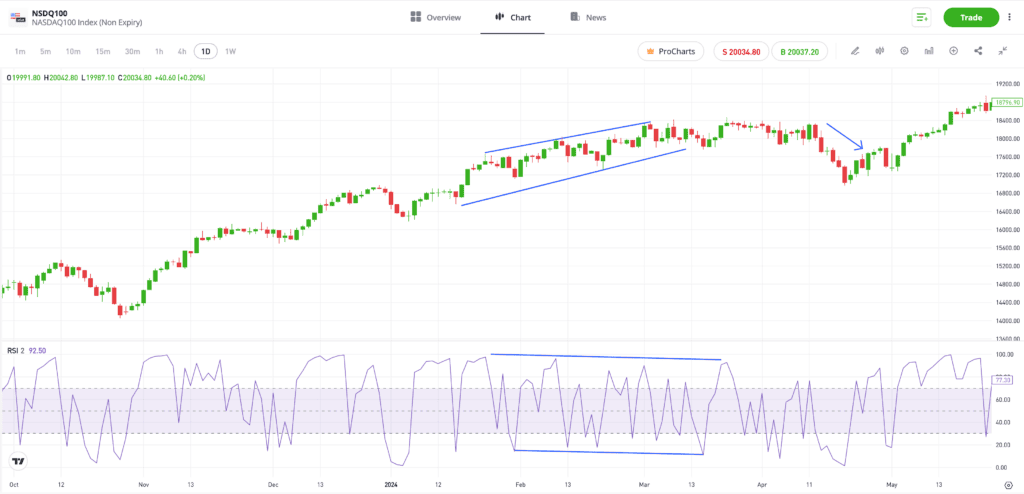
In the price chart below, the end of a long-term bullish price move in the Nasdaq 100 index is predicted by the RSI indicator developing a bearish pattern.
The blue lines in each chart highlight how the price chart is recording higher highs, but the RSI is forming a pattern of lower highs. This regular divergence signals that the trend is failing and a short period after it appears, that the trend in the NSDQ100 stalls, then reverses, and price falls.
Past performance is not an indication of future results.
Source: eToro
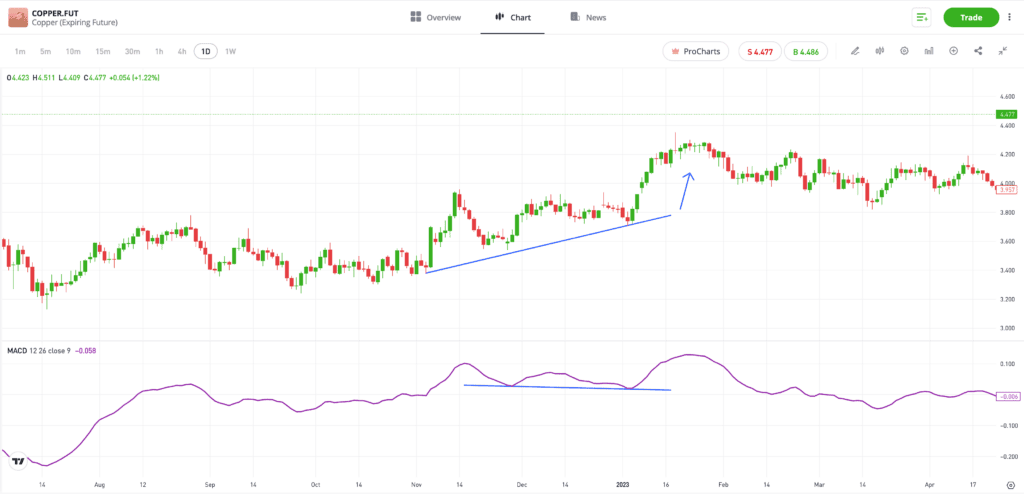
The price chart below of the copper market also shows a divergence, but as this one is “hidden,” it correctly signals the continuation of the trend.
The underlying trend is upward, so identifying a divergence relies on studying the lows of the price and the indicator chart. The price chart shows higher lows, but the MACD chart shows lower lows, and potentially a double-bottom pattern. This hidden divergence is a bullish signal, and is followed by the upward trend in the price of copper continuing as the market continues to benefit from upward momentum.
Past performance is not an indication of future results.
Source: eToro
Common mistakes to avoid
Spotting signals is one thing, but using regular divergences involves allowing time for a trend to reverse. Having a well-thought-out trading strategy and the right mindset to follow it is crucial.
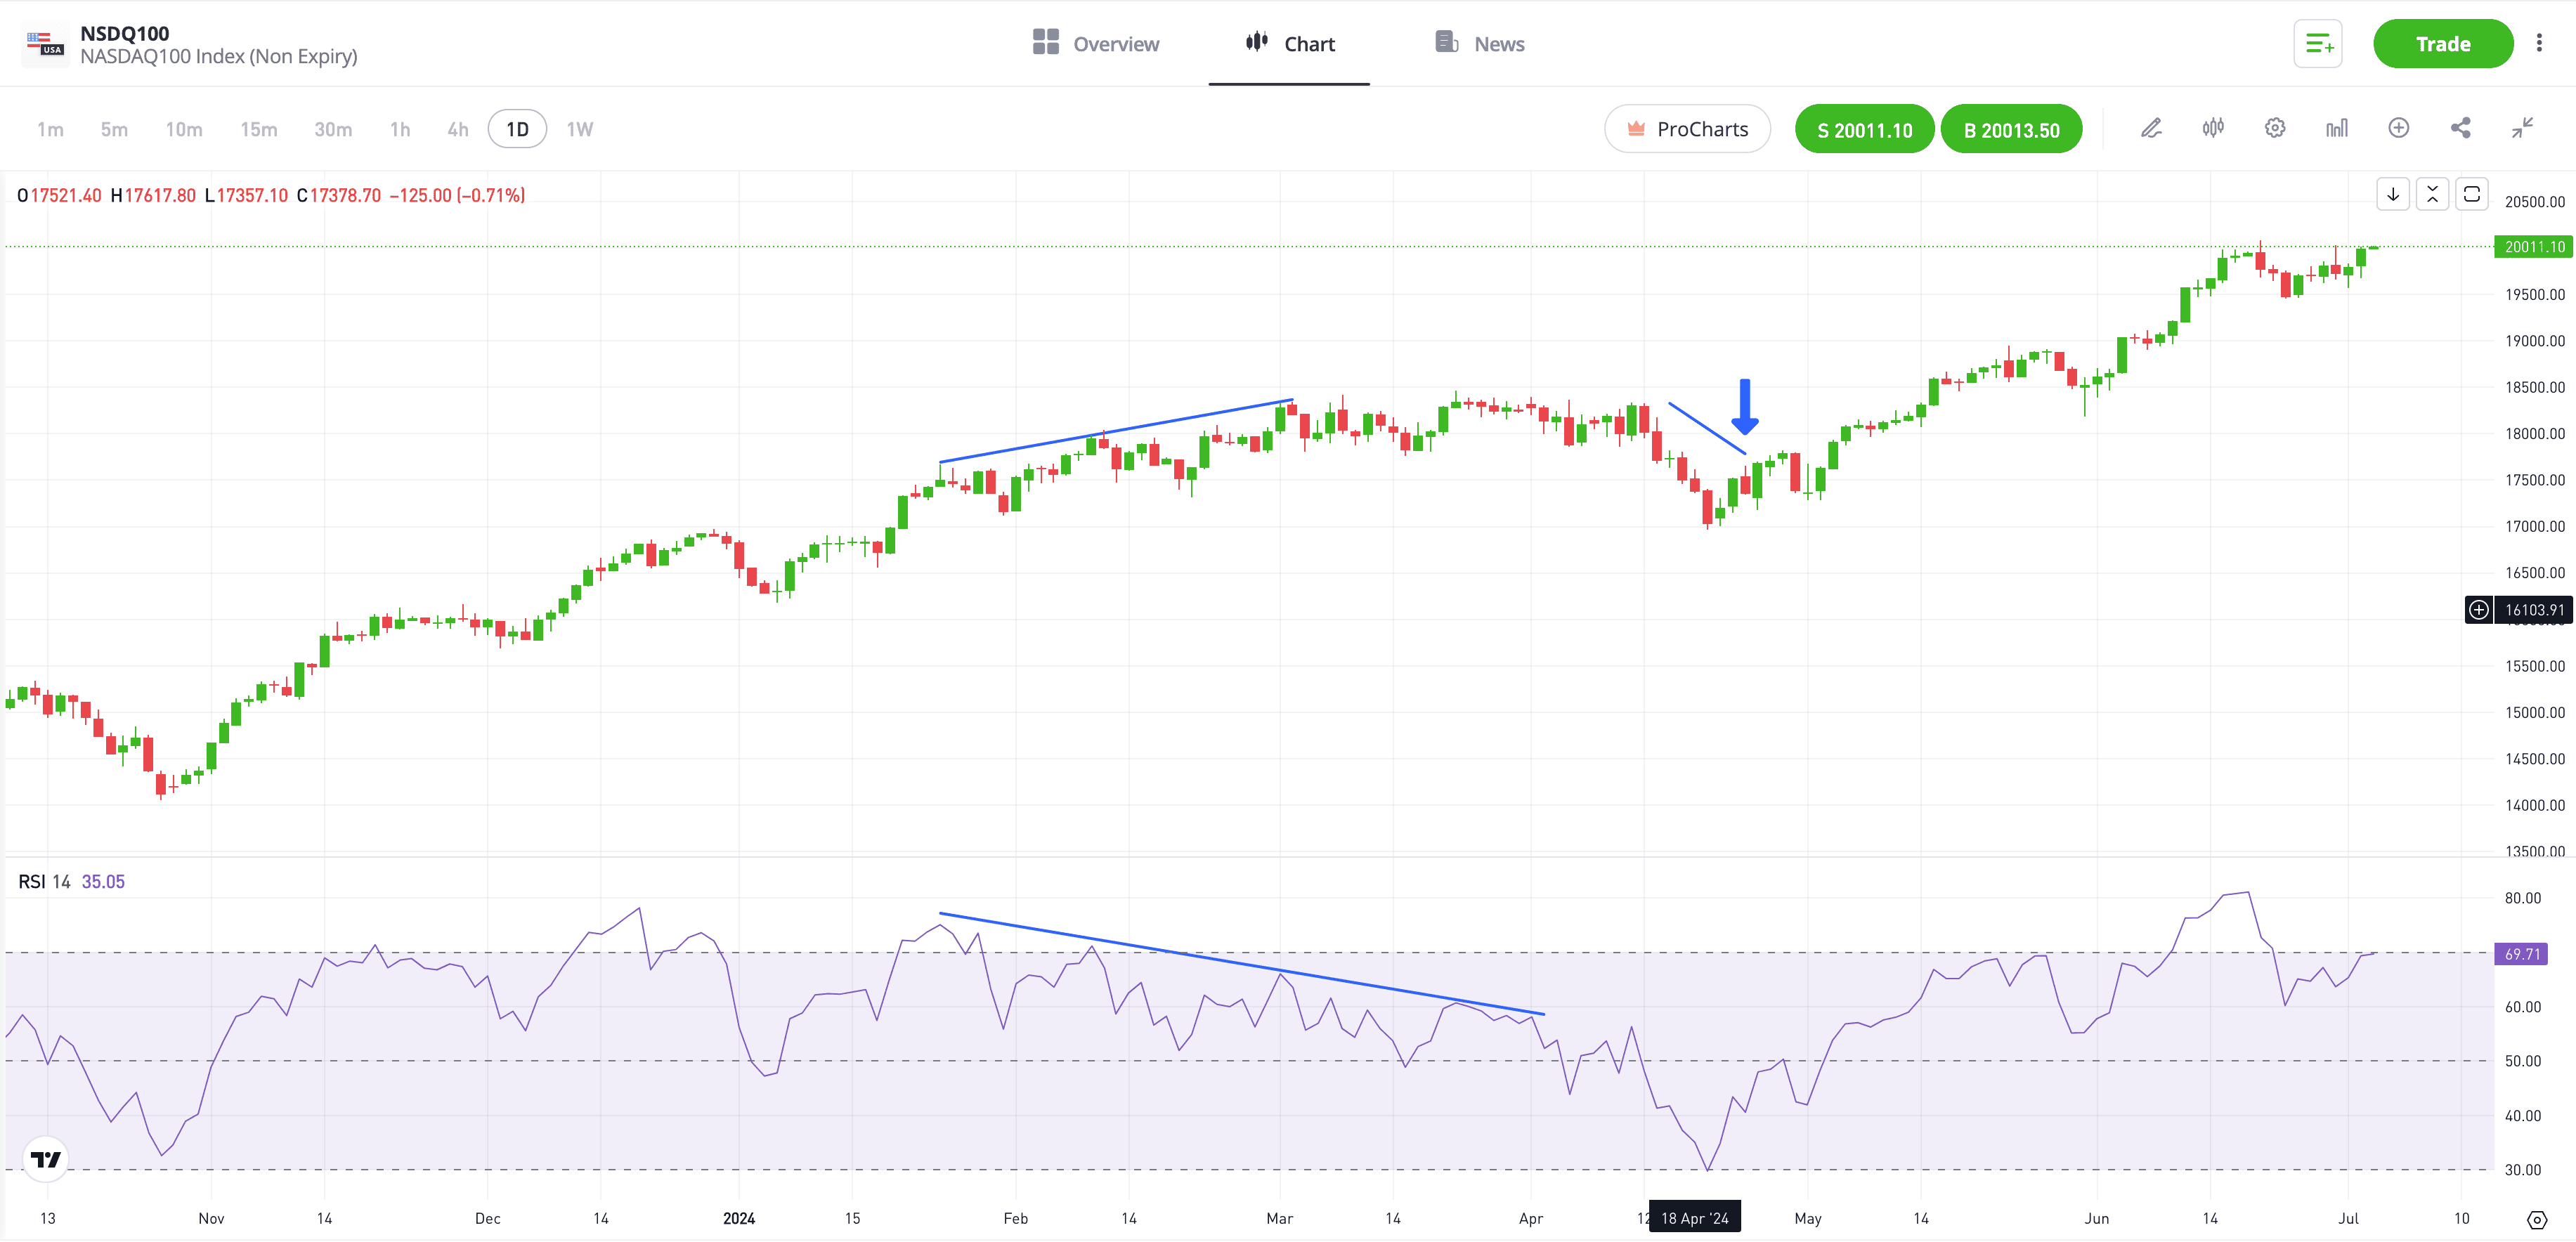
If a trader in the previous NSDQ100 example had sold short on the back of the regular divergence forming, there would likely have still been a period when that position showed a negative profit and loss (P&L). The price of the NSDQ100 did continue to rise before falling away.
Past performance is not an indication of future results.
Source: eToro
It’s also important to consider the strength of the signal. The trendlines on the RSI indicator in the Nasdaq example are relatively steep, and the downward trend continues for some time. That gradient and timescale would have enabled a short-selling trader to have greater confidence that the reversal would eventually take place.
It’s also important to remember that market conditions change, and trading divergence-based strategies requires continued monitoring. If the RSI in the NSDQ100 setup had begun to reverse before the price fall materialised, then the signal would have been considered to have failed, and closing out positions, even if at a loss, would have been advisable.
Tip: Not all trades will be winners; losses need to be accepted and managed effectively.
The practice of trading divergences also requires you to make sure that your analysis tools are set up correctly. Indicator charts can be adjusted to different time frames and to use data feeds from different sources such as simple moving averages, exponential moving averages and weighted moving averages.
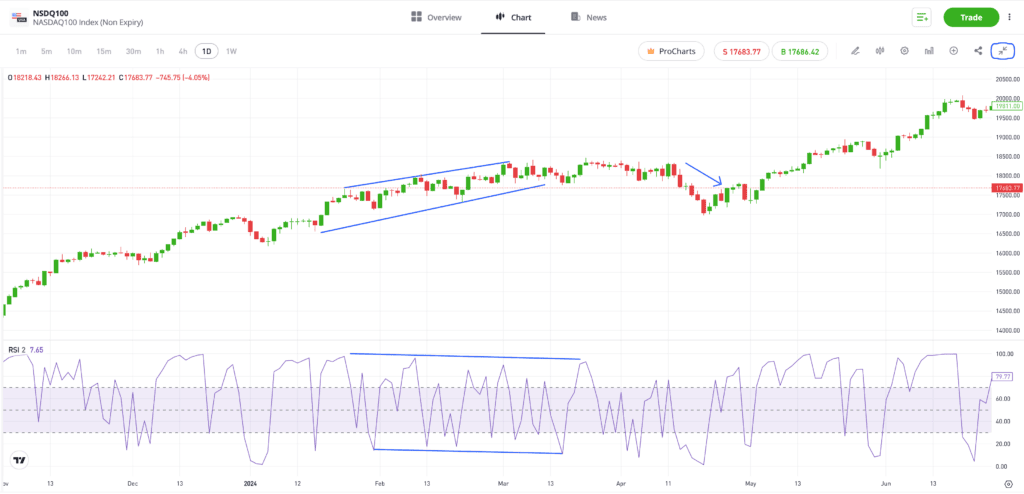
To highlight how errors can occur, the price chart below tracks the same situation, but uses a different time period setting in the RSI chart. This results in there being little discernible sign of a divergence about to occur.
Past performance is not an indication of future results.
Source: eToro
Tip: When formatting your indicator, remember the coding adage about the integrity of a data source: “Garbage in, garbage out”.
Integrating divergence analysis into your trading strategy
The principles of divergence analysis are relatively straightforward, but it is equally important to know when and how to apply it. As with other technical analysis indicators, it can be more effective when markets are quieter and there are fewer news events and macroeconomic factors influencing price.
The trend reversal in the NSDQ100 could have turned out very differently if the US Federal Reserve had made a surprise announcement that it was cutting interest rates to boost the economy — as well as investor sentiment at the same time.
Strategic considerations for divergence-based decisions
If you’re thinking of using divergence analysis, one of the biggest decisions you will have to make is in which market you want to trade. Asset groups such as currencies, stocks, commodities and cryptoassets have different characteristics. A strategy you are using in one market may stop working and be better applied elsewhere.
Also consider how markets change over time. Increases in price volatility or trade volumes may make your strategy more or less effective. Consider using a demo account to run different strategies in different markets until you establish which one is worthy of having real cash applied to it.
Combining divergences with other technical indicators
One of the most enduring pieces of advice regarding technical analysis is that the greater the number of indicators pointing in the same direction, the stronger the overall signal. Divergence analysis is no different. Other indicators can be used to double-check whether a trading opportunity is as promising as it first appears.

Final thoughts
The fact that divergence indicators are a leading indicator makes them a particularly useful tool. Getting used to the subtle differences between regular and hidden divergences can take a bit of practice, but investing in developing your understanding can help you to decide when to open and close positions and form a crucial part of your trade management policy.
Divergence analysis is a useful tool, but it is always best used in conjunction with other forms of research. No indicator is correct 100% of the time, but since spotting and following trends is such an important part of successful trading, it is worth incorporating divergence analysis into whatever other forms of research you use to try to tip the odds in your favour.
Essentially, investors should seek to use divergence analysis to inform their investment strategy, and make a well-informed approach to investment decisions. Building a trading strategy, in line with your risk appetite and financial goals, remains the key to successful trading.
Visit the eToro Academy now to learn more about using divergences in technical analysis.
Quiz
FAQs
- How do divergences signal potential market reversals?
-
Divergences signal a disconnect between price moves in an asset and trade indicators in the same market that use different metrics and data sources to offer an alternative interpretation. Using them is as simple as studying two charts and identifying times when one shows a bullish pattern, and the other one shows a bearish pattern.
- What are the key differences between regular and hidden divergences?
-
Regular divergences signal that a trend is losing momentum and could be about to break down. Hidden divergences indicate that a trend is likely to continue to move in the same direction. They both use the same price charts and indicators, but involve studying different features of those charts.
- How can traders confirm divergence signals before executing trades?
-
A trader’s personal risk appetite will play an important part when determining how strong a signal needs to be before booking a trade. A more risk-averse approach would involve waiting for a series of highs or lows to be more than two dips or peaks long, and for the gradient of the trend lines to be steeper.
This information is for educational purposes only and should not be taken as investment advice, personal recommendation, or an offer of, or solicitation to, buy or sell any financial instruments.
This material has been prepared without regard to any particular investment objectives or financial situation and has not been prepared in accordance with the legal and regulatory requirements to promote independent research. Not all of the financial instruments and services referred to are offered by eToro and any references to past performance of a financial instrument, index, or a packaged investment product are not, and should not be taken as, a reliable indicator of future results.
eToro makes no representation and assumes no liability as to the accuracy or completeness of the content of this guide. Make sure you understand the risks involved in trading before committing any capital. Never risk more than you are prepared to lose.