“Bull market” and “bear market” are two terms used frequently by investors. Both are associated with dramatic price moves, with the phrases introduced into the financial markets to help investors understand and react to certain situations. Discover what a bull market and bear market are and how to spot them.
“Bear market” and “bull market” are terms used to explain price trends. Bull markets are periods in which the underlying price move is upwards, while the opposite is true of bear markets.
What is a bear market?
A bear market describes a time period during which assets fall in value. Although the term is used frequently, a market can only be considered a true bear market if it experiences more than a 20% fall in price from the previous high.
Tip: If a market falls more than 5% but less than 20% in a single day, the phrase “bearish” is often used. This reflects a panicked market and widespread selling.

What is a bull market?
A bull market involves the value of the financial markets going up for a prolonged period. Two good indicators of a bull market include:
- Prices rising by 20% from the previous low
- Prices registering an all-time high
A market may be termed “bullish” even if it hasn’t reached either of those benchmarks.
Tip: Bull and bear markets can occur in any asset class, including commodities, currencies, cryptoassets and bonds. However, the term is most commonly used in connection with equity markets.

A bear market vs a bull market
A bull market is often the default position for stock markets. Historic price charts tend to show equity markets making measured and gradual gains, interrupted by dramatic, shorter-lived price crashes. Markets work in cycles, and although they are a perfectly natural part of investing, bear markets can cause investors to panic. These shorter-term price falls are one of the key reasons that investors should only invest what they can afford to lose.
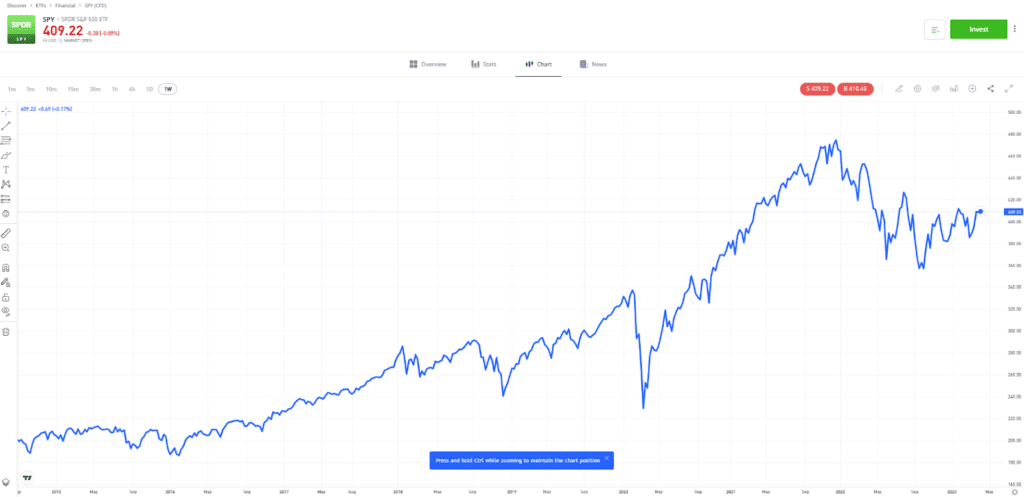
In the below example of the S&P 500 Index, it is possible to see that despite frequent price drops, the market continues to trend upwards over a long-term period.
| SPDR S&P 500 ETF (SPY) – 2014–2023 |

For illustration purposes. Past performance is not an indication of future results
Source: eToro
Trading a bear market vs trading a bull market
Trading a bear market is very different to trading a bull market, and an investor’s approach to the market will vary depending on their starting position, investment aims and
In a bear market, a
Investors can make decisions based on past price history and economic fundamentals during a bull market. On the other hand, bear markets can often lead to panic and short-term overselling, so they need to be treated differently.
Bull vs bear market trading strategies
There is no specific way of trading bull or bear markets that will suit all trading styles or guarantee profits. However, there are a number of different strategies implemented by investors that could be considered for your own investment plan.
Momentum strategies
Momentum strategies are perhaps best explained by the phrase: “join the party late and leave it early.” Momentum investing aims to take advantage of continuing trends and can be applied in both bull and bear markets. It uses momentum indicators to determine the direction of travel, and when a market may have overshot and be about to reverse.
Trend strategies
Trend strategies are often favoured by fans of
Breakout
Some strategies try to pinpoint when
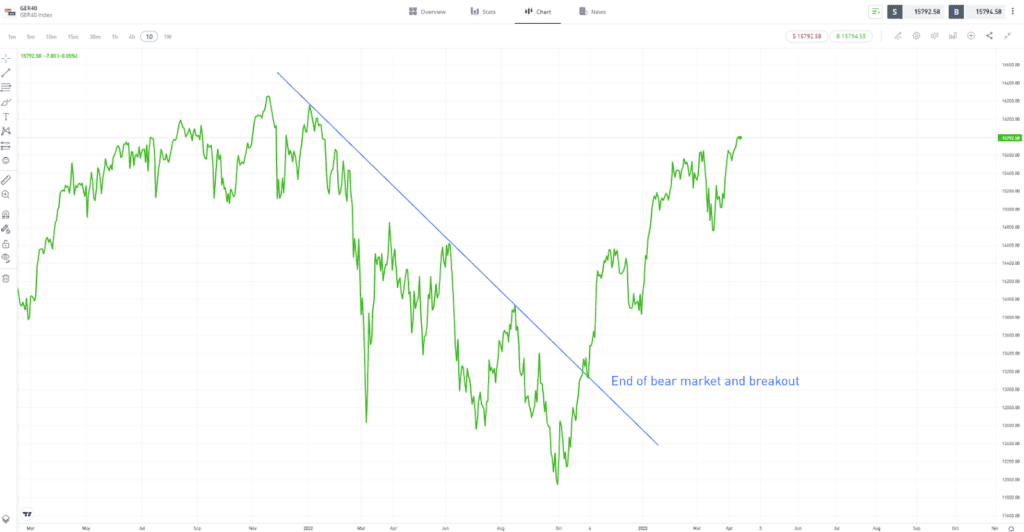
In the below example of the Germany 40 Index, you can see the price breaking out of a downwards price trend, marking an extended period of positive price movements.
| Germany 40 Index (GER40) – 2021–2023 |

For illustration purposes. Past performance is not an indication of future results
Source: eToro
Scaling out of positions to buy back later
Some investors enter the market by buying assets, such as stocks. When a bear market occurs, they may scale back on some of their
How to spot a bear market
Bear markets are often triggered by a loss of investor confidence. Catalysts for the shift can include rising interest rates, geopolitical events or, sometimes, just a bull market overextending itself.
A market sell-off can be exacerbated if the event is linked to a liquidity crisis. This involves retail and institutional investors who have invested using borrowed money, referred to as leveraging, becoming forced sellers and looking to offload some of their assets and convert them into cash. This can trigger a downward price spiral.
Tip: There is a difference between investing and trading. The former relates to those with long-term investment goals, and the latter suits those who look to profit from short-term market moves.
How to spot a bull market
Historic stock price charts show that equity markets typically spend more time in bull market mode, rather than bear market mode. After spotting and investing in a bull market, investors try to anticipate the occurrence of sell-offs, price corrections and bear markets.
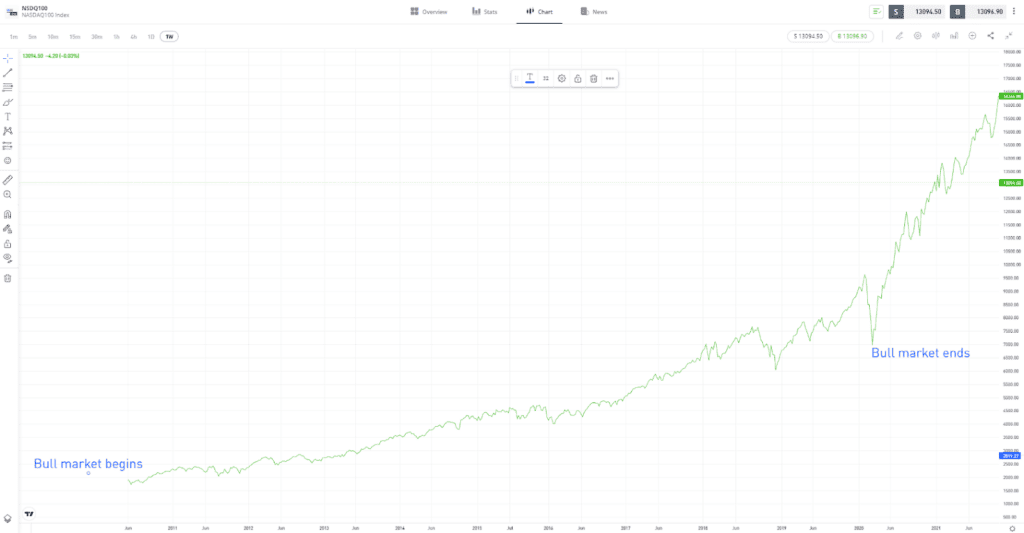
The chart below shows that there were peaks and troughs throughout the NASDAQ’s 2009–2020 bull run, but these did not signal the end of the bull market. Instead, the bull market ended after the price slumped more than 20% in March 2020.
| Nasdaq 100 Index (NSDQ) – 2010–2023 |

For illustration purposes. Past performance is not an indication of future results
Source: eToro
“There is only one side of the market and it is not the bull side or the bear side, but the right side.”
Jesse Livermore

Final thoughts
Asset prices don’t move up or down in a straight line. Some traders try to trade short-term
Visit the eToro Academy to learn more about bear and bull markets and how to trade them.
FAQs
- How long do bull and bear markets typically last?
-
Bear and bull markets can last for varying amounts of time. For example, the Wall Street crash of 1929 was the key event in a drawn-out bear market that lasted almost three years. On the other hand, the Nasdaq 100 Index experienced a bull market between 2009 and 2020, where it increased in value by 747%.
- What is the shortest bear market in history?
-
The Covid-related crash in equity markets between 20th February and 24th March 2020 saw the S&P 500 Index lose more than 30% in value. By 6th April, the market had rebounded positively by 20%, making it the shortest bear market in history.
- Are there times when a market isn’t either bullish or bearish?
-
There are periods when markets trend sideways. This doesn’t mean that a market has switched from being bullish or bearish. Instead, it can mean that price is
consolidating and waiting to continue in the same direction. Alternatively, it can mean a reversal is about to take place.
This information is for educational purposes only and should not be taken as investment advice, personal recommendation, or an offer of, or solicitation to, buy or sell any financial instruments.
This material has been prepared without regard to any particular investment objectives or financial situation and has not been prepared in accordance with the legal and regulatory requirements to promote independent research. Not all of the financial instruments and services referred to are offered by eToro and any references to past performance of a financial instrument, index, or a packaged investment product are not, and should not be taken as, a reliable indicator of future results.
eToro makes no representation and assumes no liability as to the accuracy or completeness of the content of this guide. Make sure you understand the risks involved in trading before committing any capital. Never risk more than you are prepared to lose.


